Only 13.8% of European Products Actually Got a Real Discount
Amazon moved Prime Day to June this year, ran it across 26 countries, and generated headlines about record-breaking sales. We tracked 1.19 million products across the European market to see what actually happened to prices. The answer: not much, for most of them.
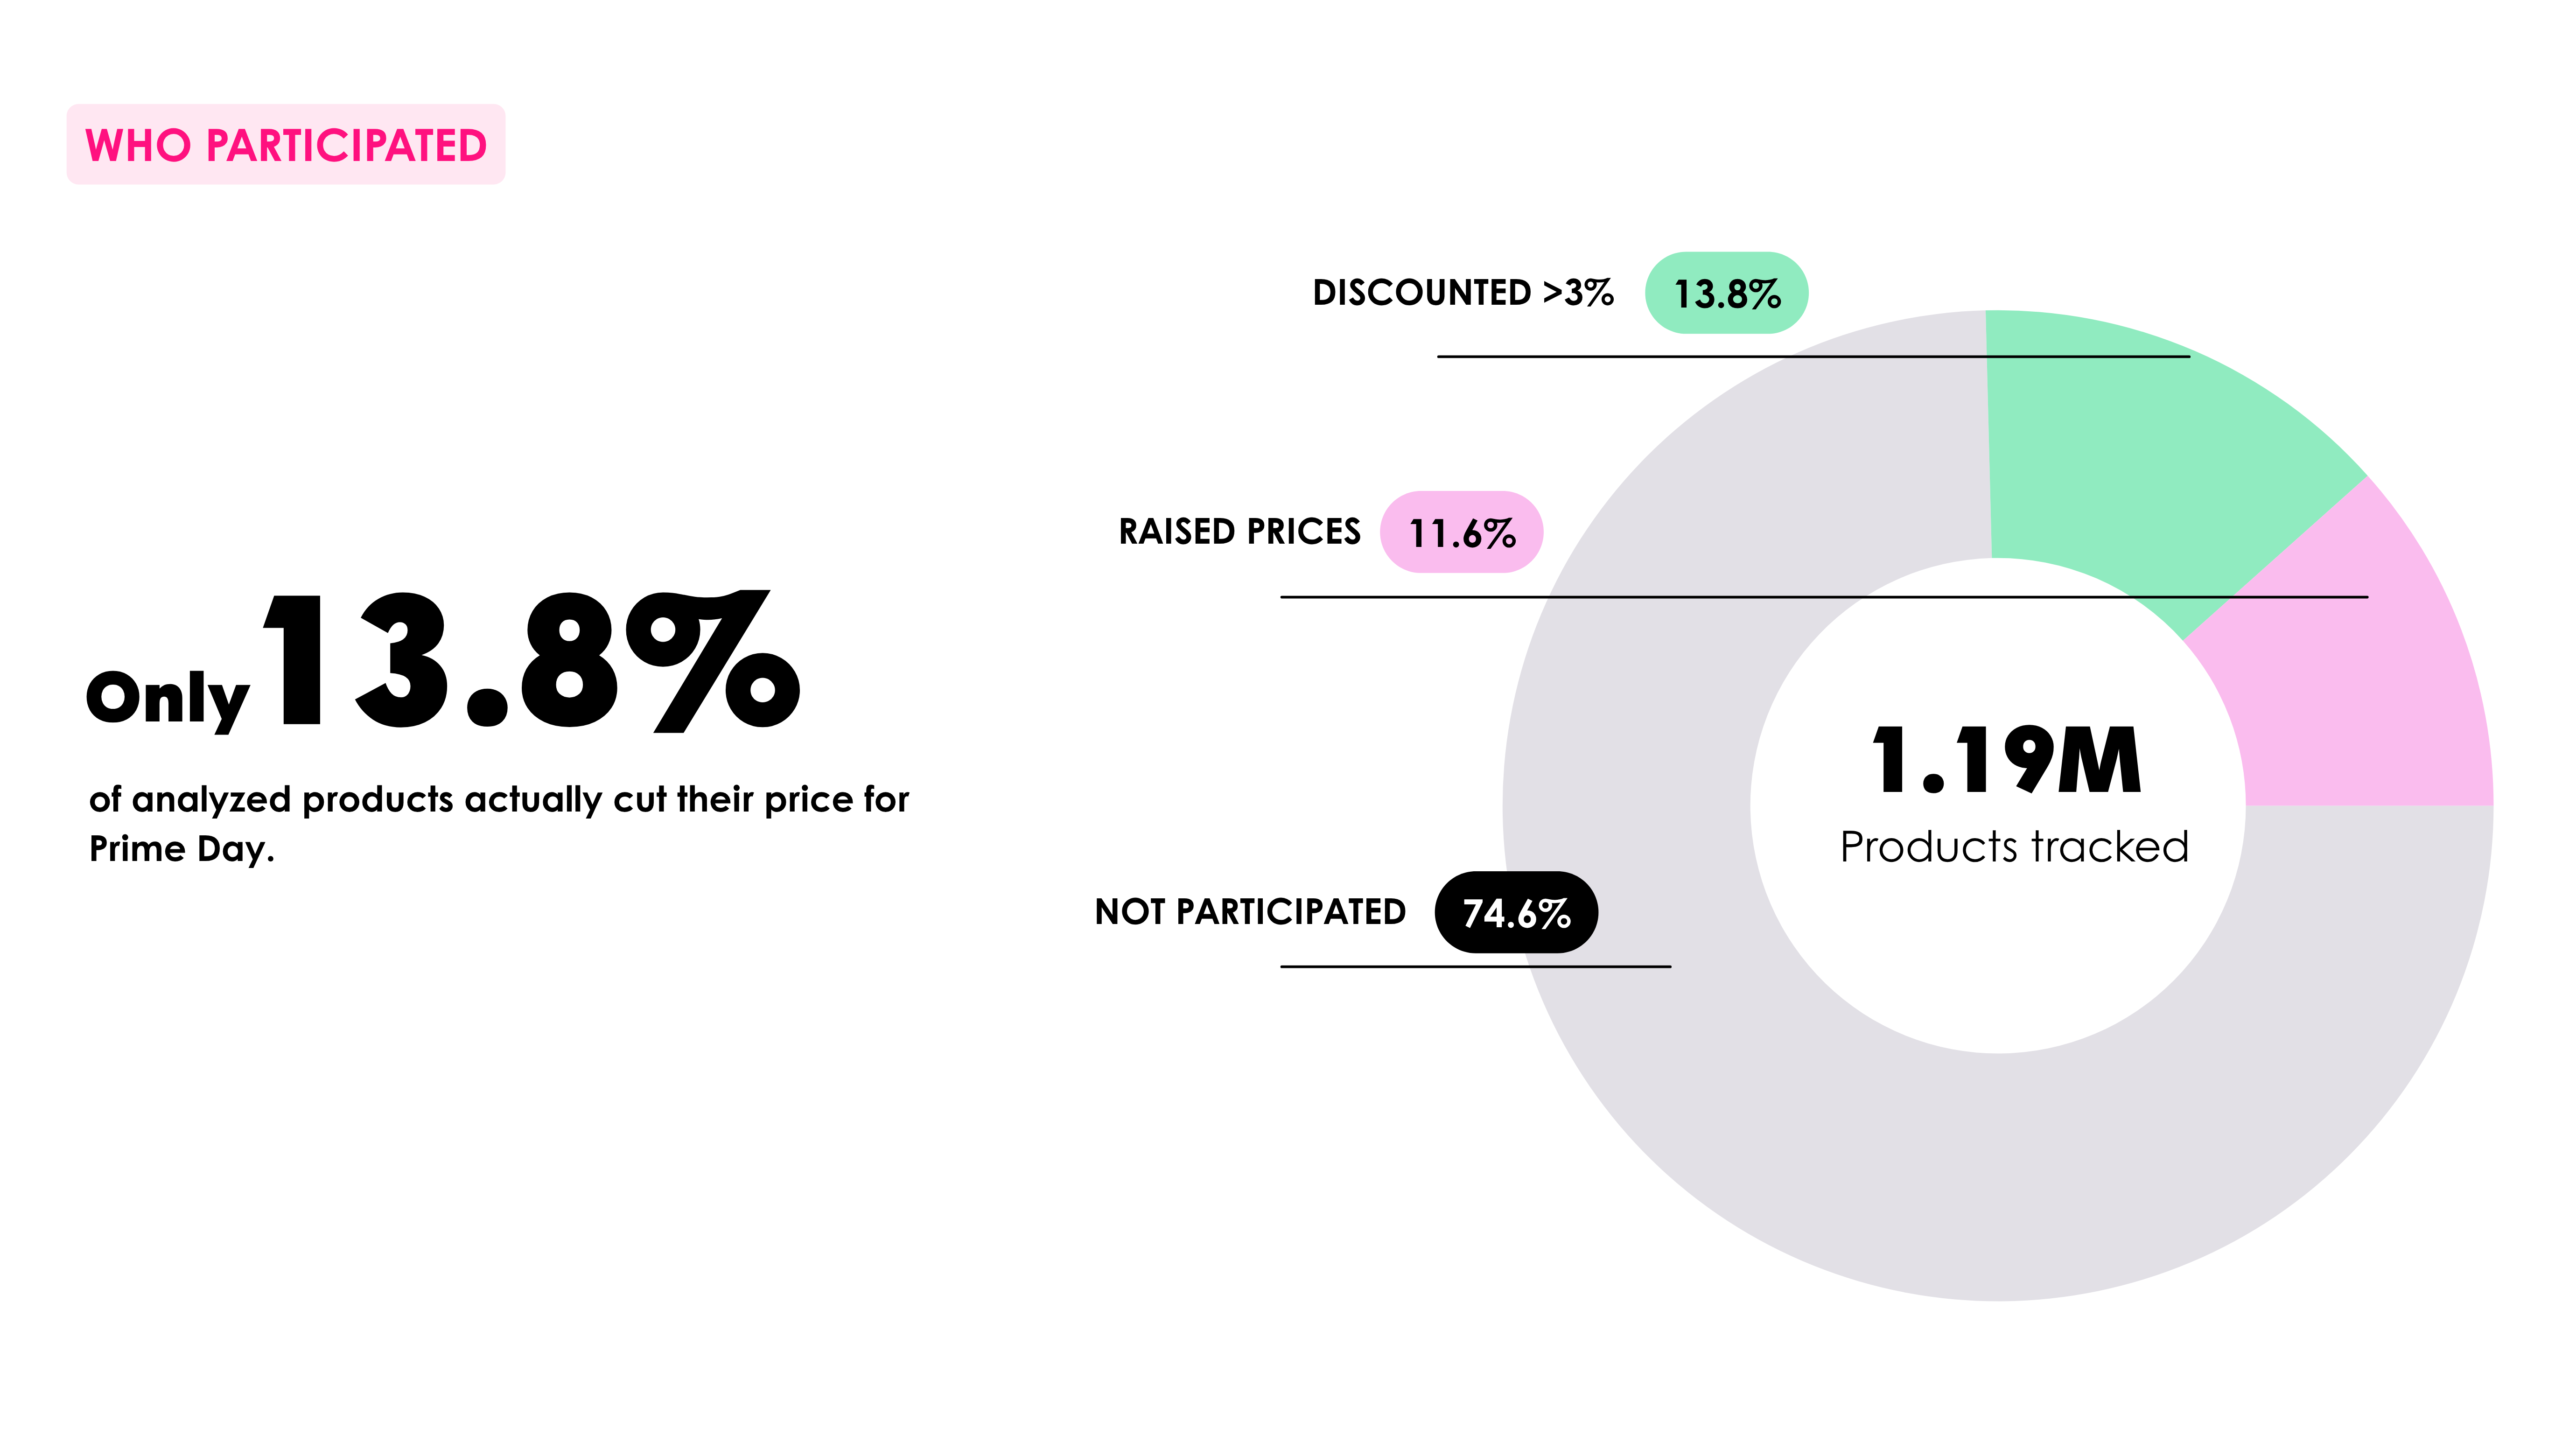
Just 13.8% of tracked products saw a genuine price cut of more than 3%. Another 11.6% got more expensive. The remaining 74.6%, three out of every four products in our dataset, didn't move at all. For an event built entirely on the premise of a deal, most of the catalog never became one.
The discounts that did happen were shallow
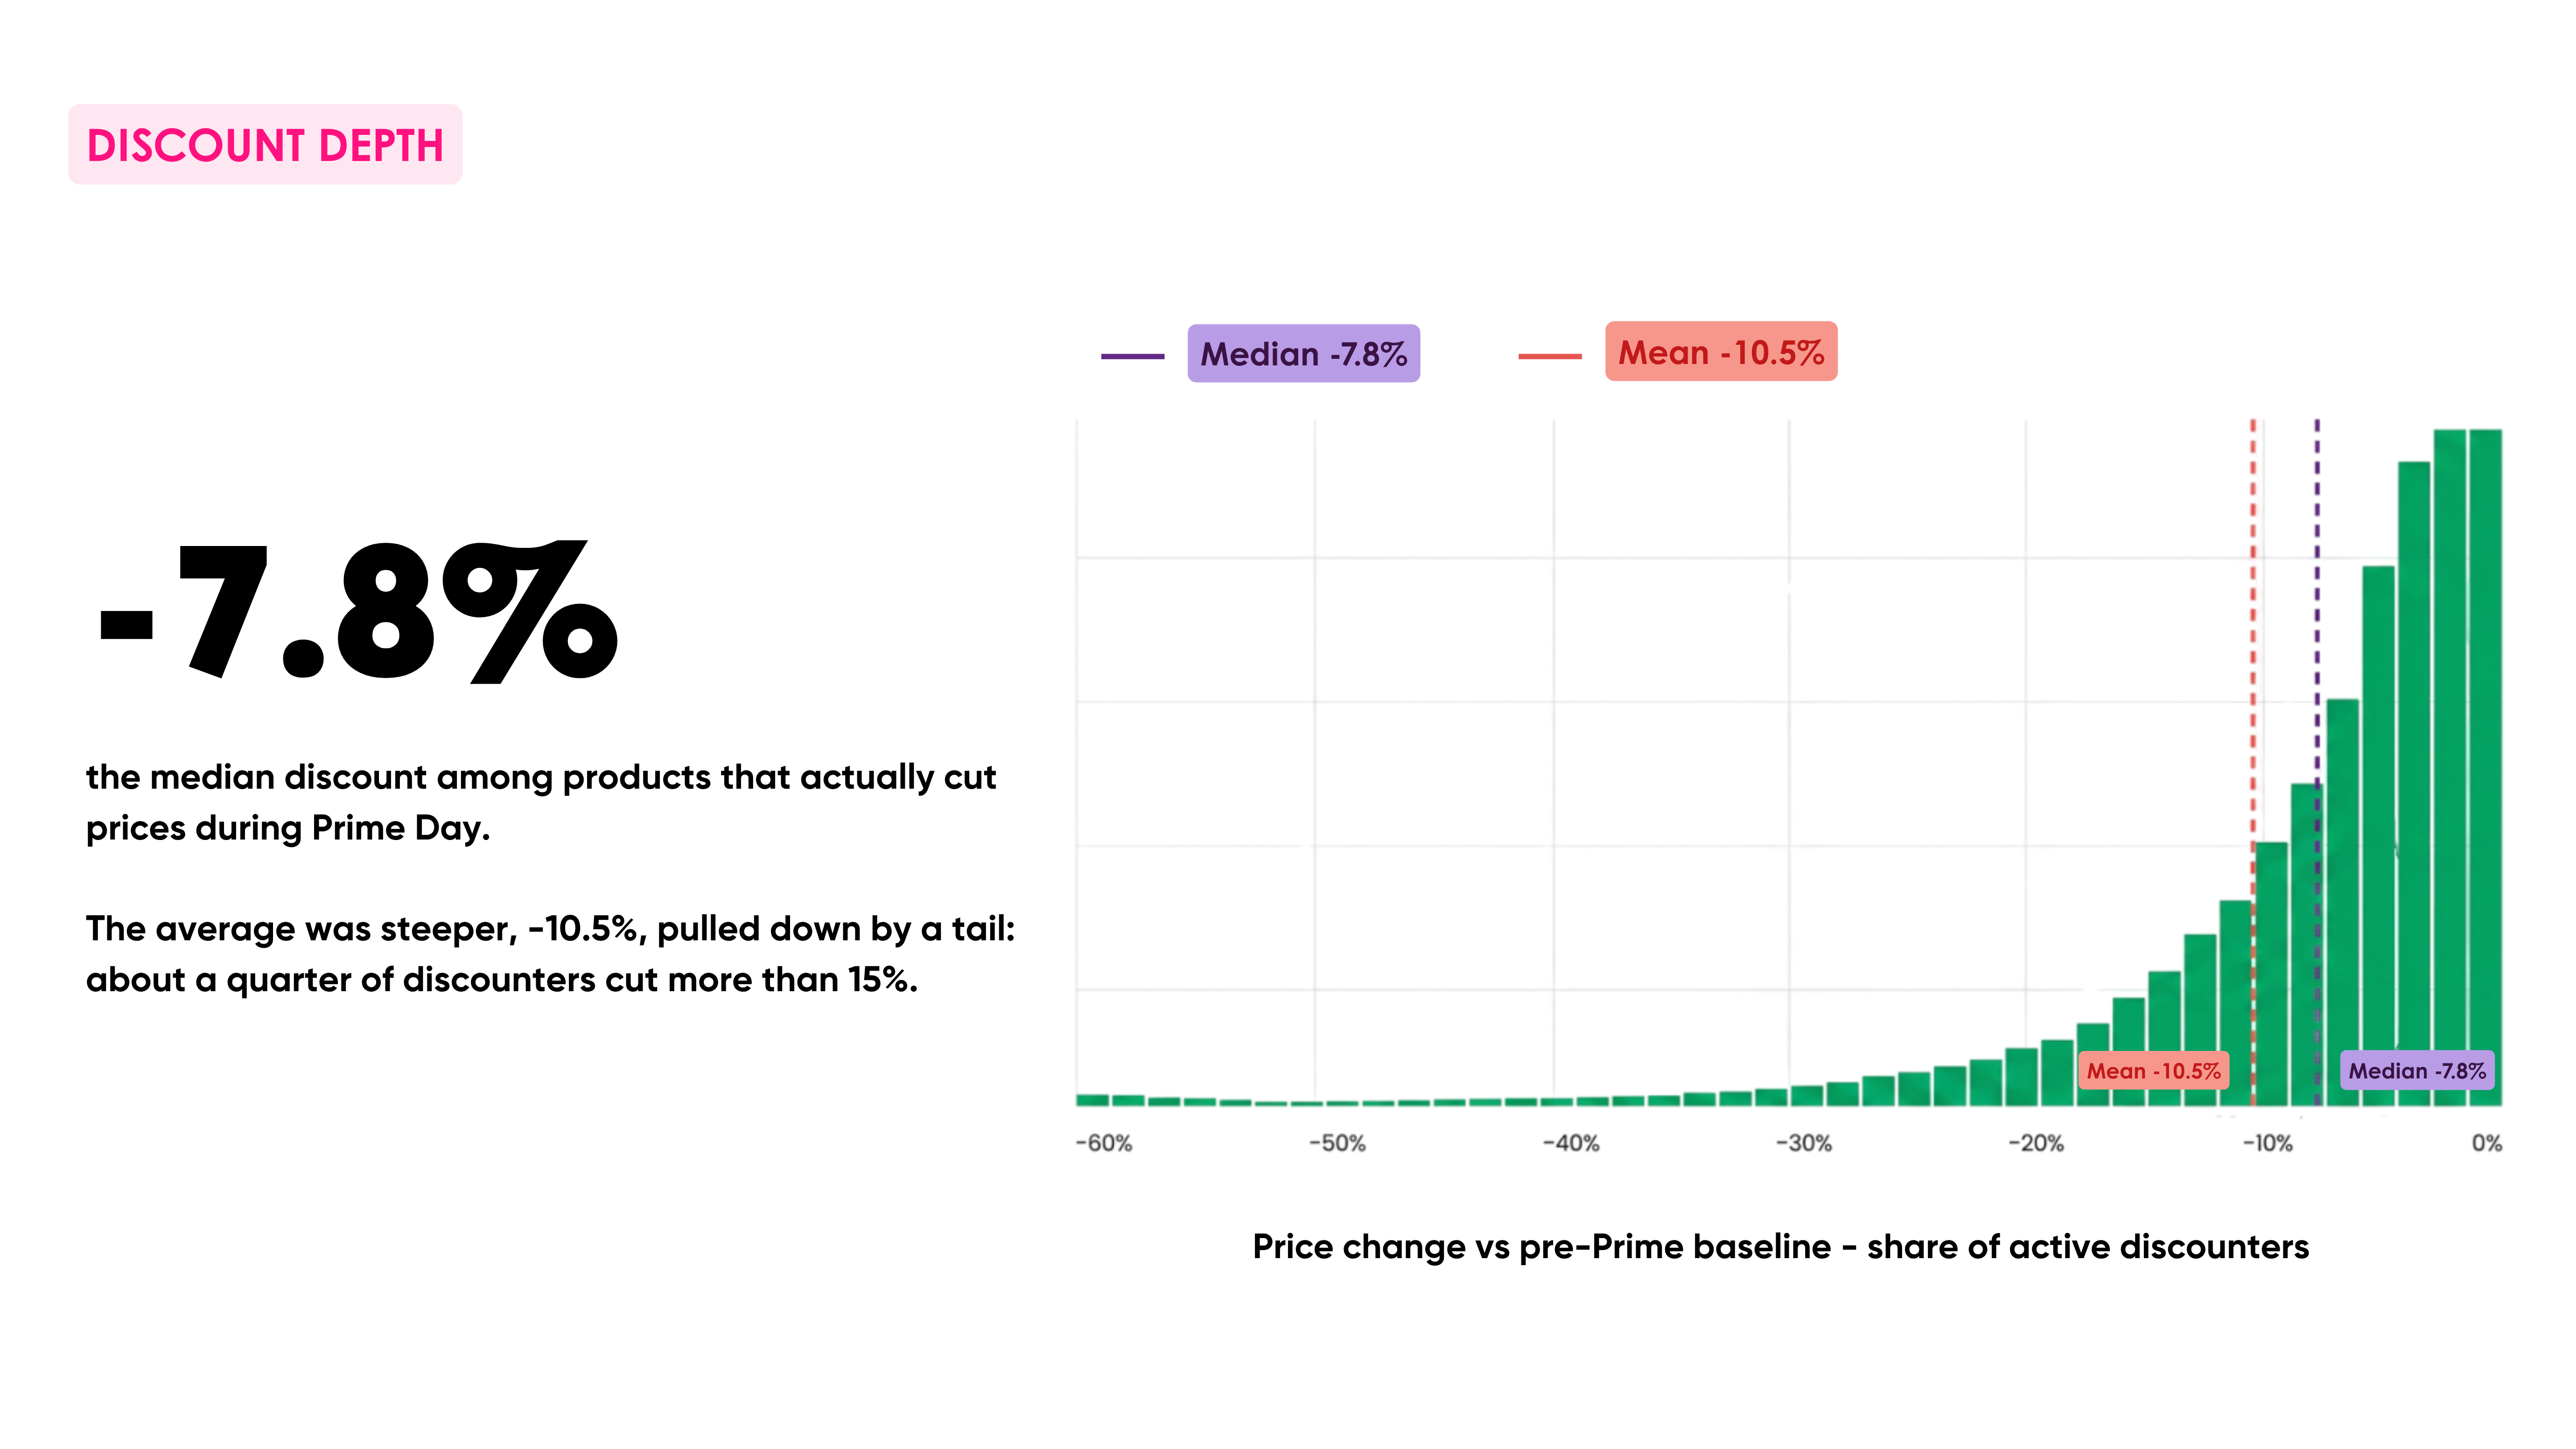
Among the 13.8% that did cut prices, the median discount was 7.8%. The average came in steeper, at 10.5%, dragged up by a long tail: roughly a quarter of discounters cut more than 15%. But the typical Prime Day "deal" in our dataset wasn't a doorbuster. It was a price nudge.
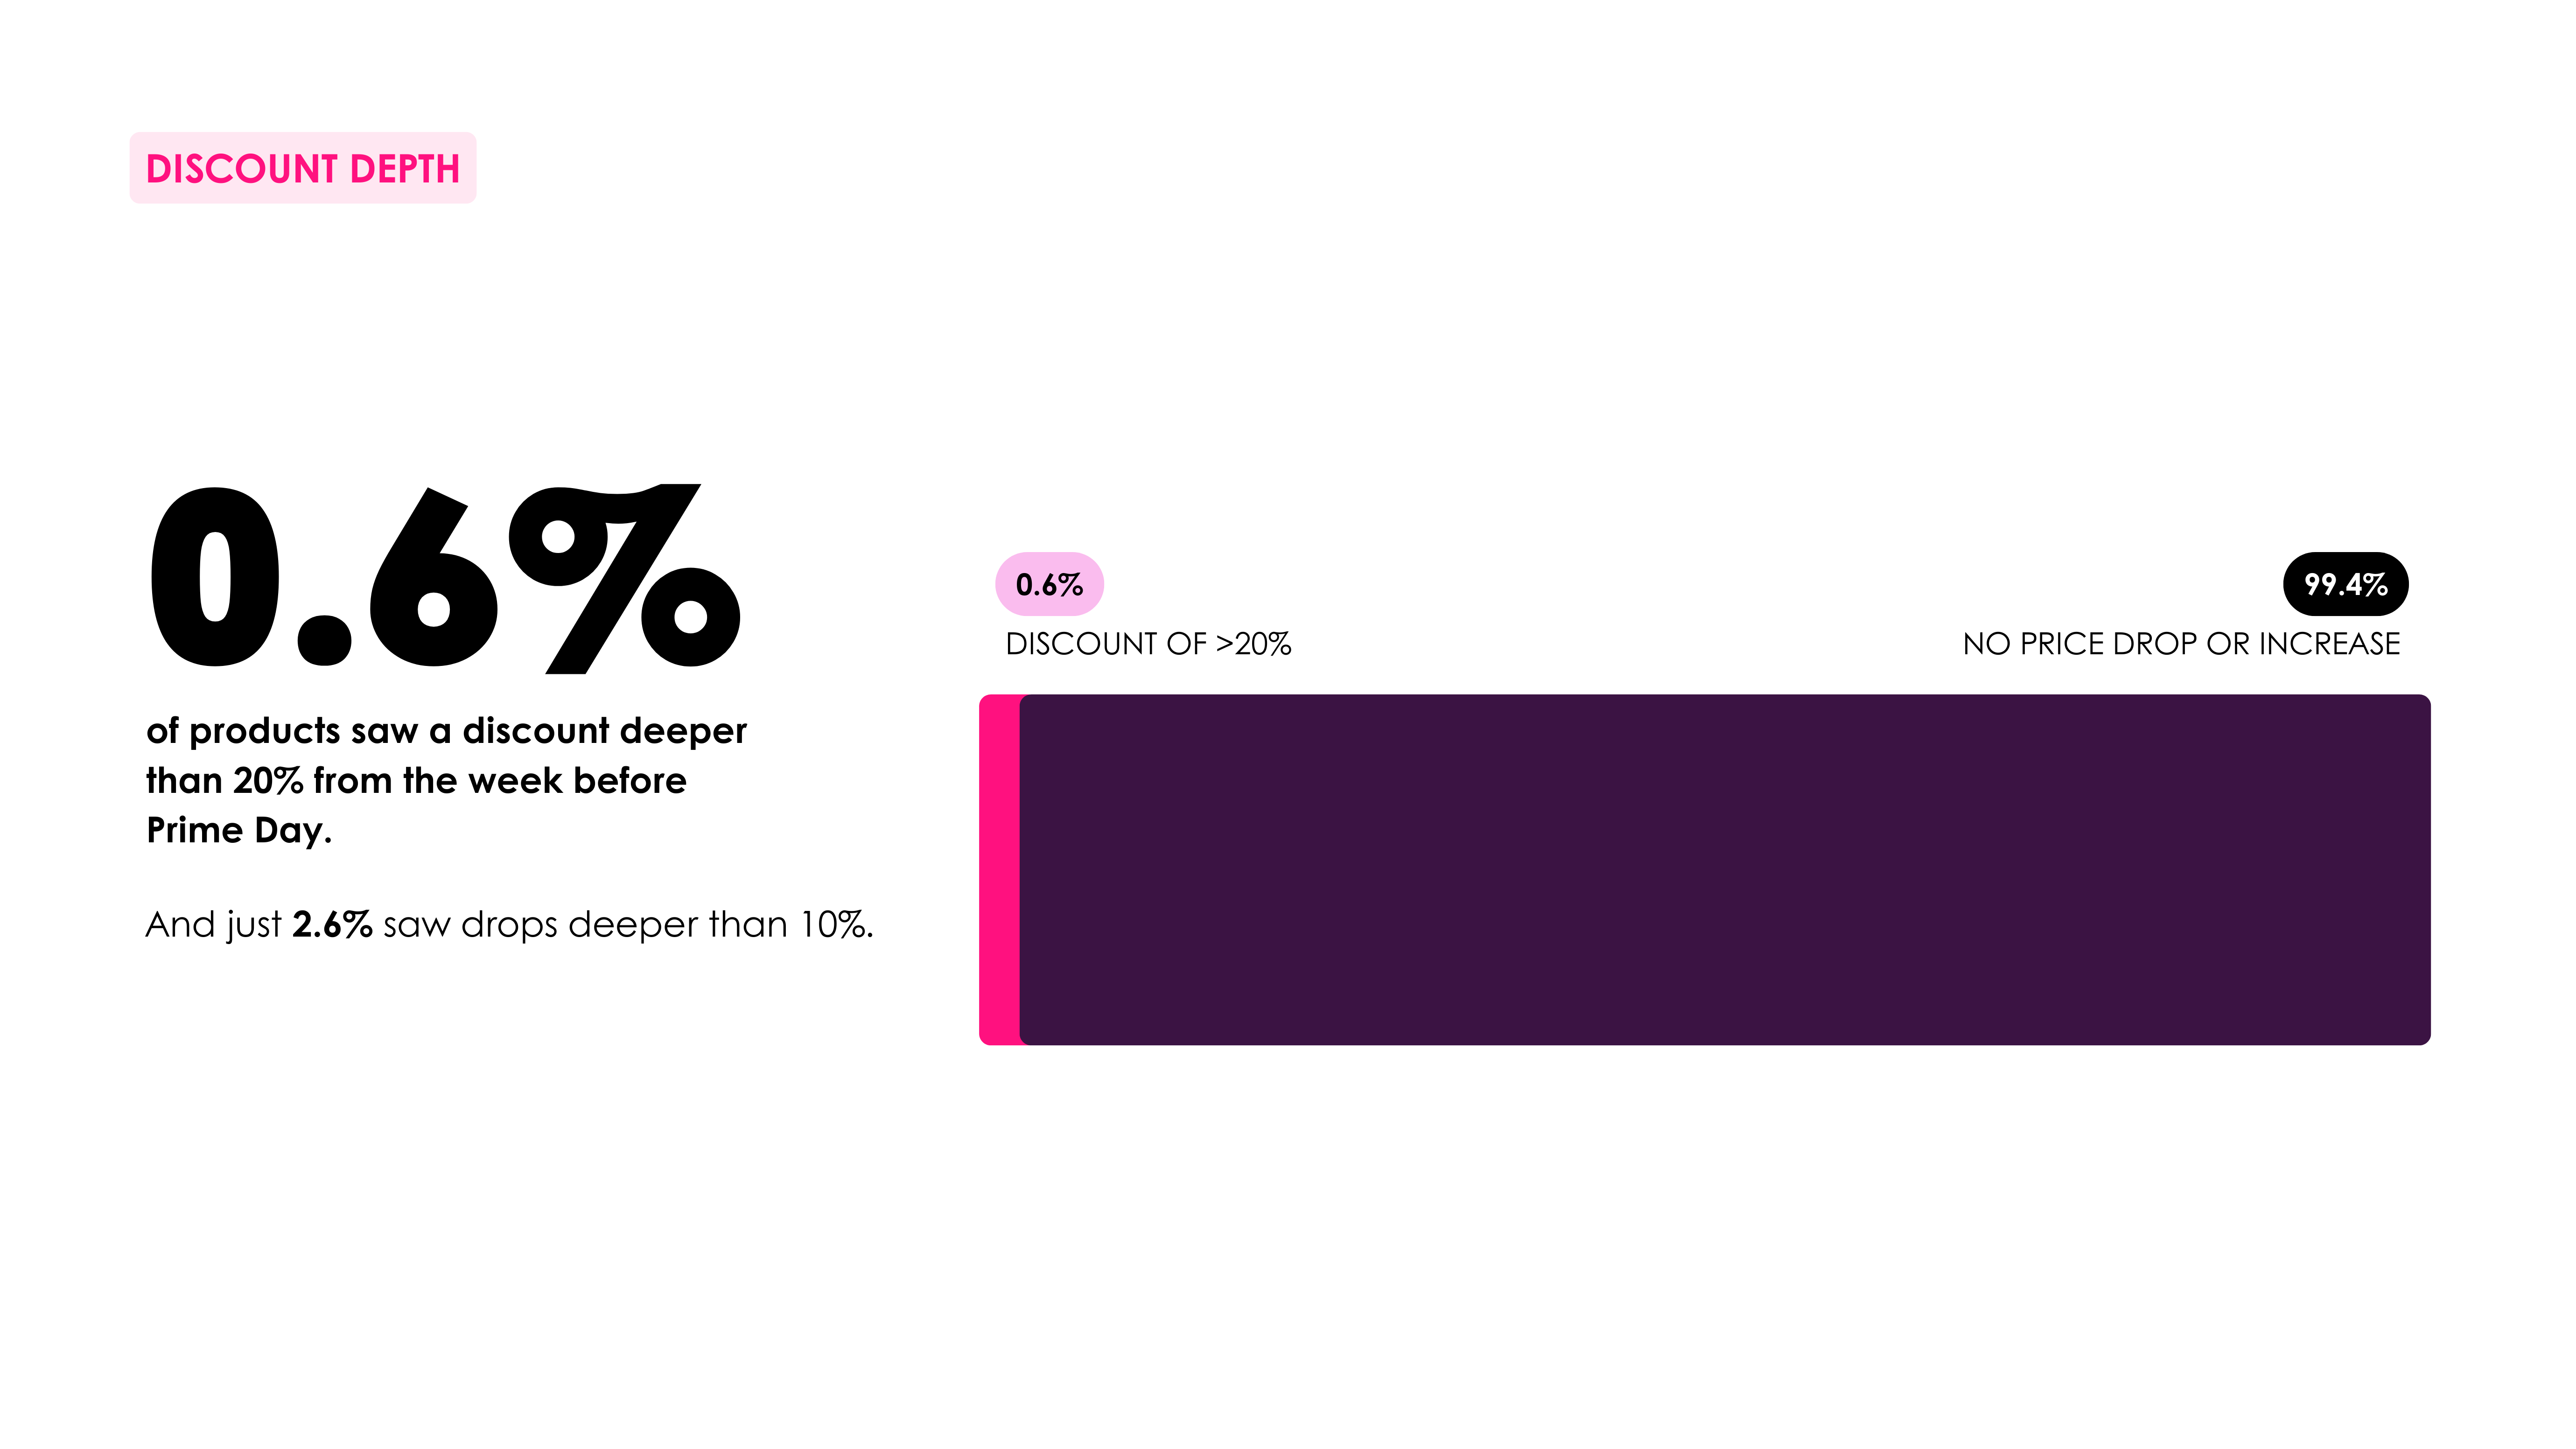
This lines up with what we found in 2025's Prime Day data, even though the two years measured slightly different windows and thresholds. Last year, 54.9% of products showed no price drop from the week before the event to Prime Day itself, and 45.5% actually cost more. Among the ones that did drop, only 0.6% fell more than 20%, and just 2.6% fell more than 10%. This year's stricter threshold (a genuine cut above 3%) produces a smaller "discounted" number, but the underlying story hasn't changed: a large majority of what's badged as a Prime Day deal was never meaningfully repriced.
Price hikes, then a real cut, then a slow crawl back up
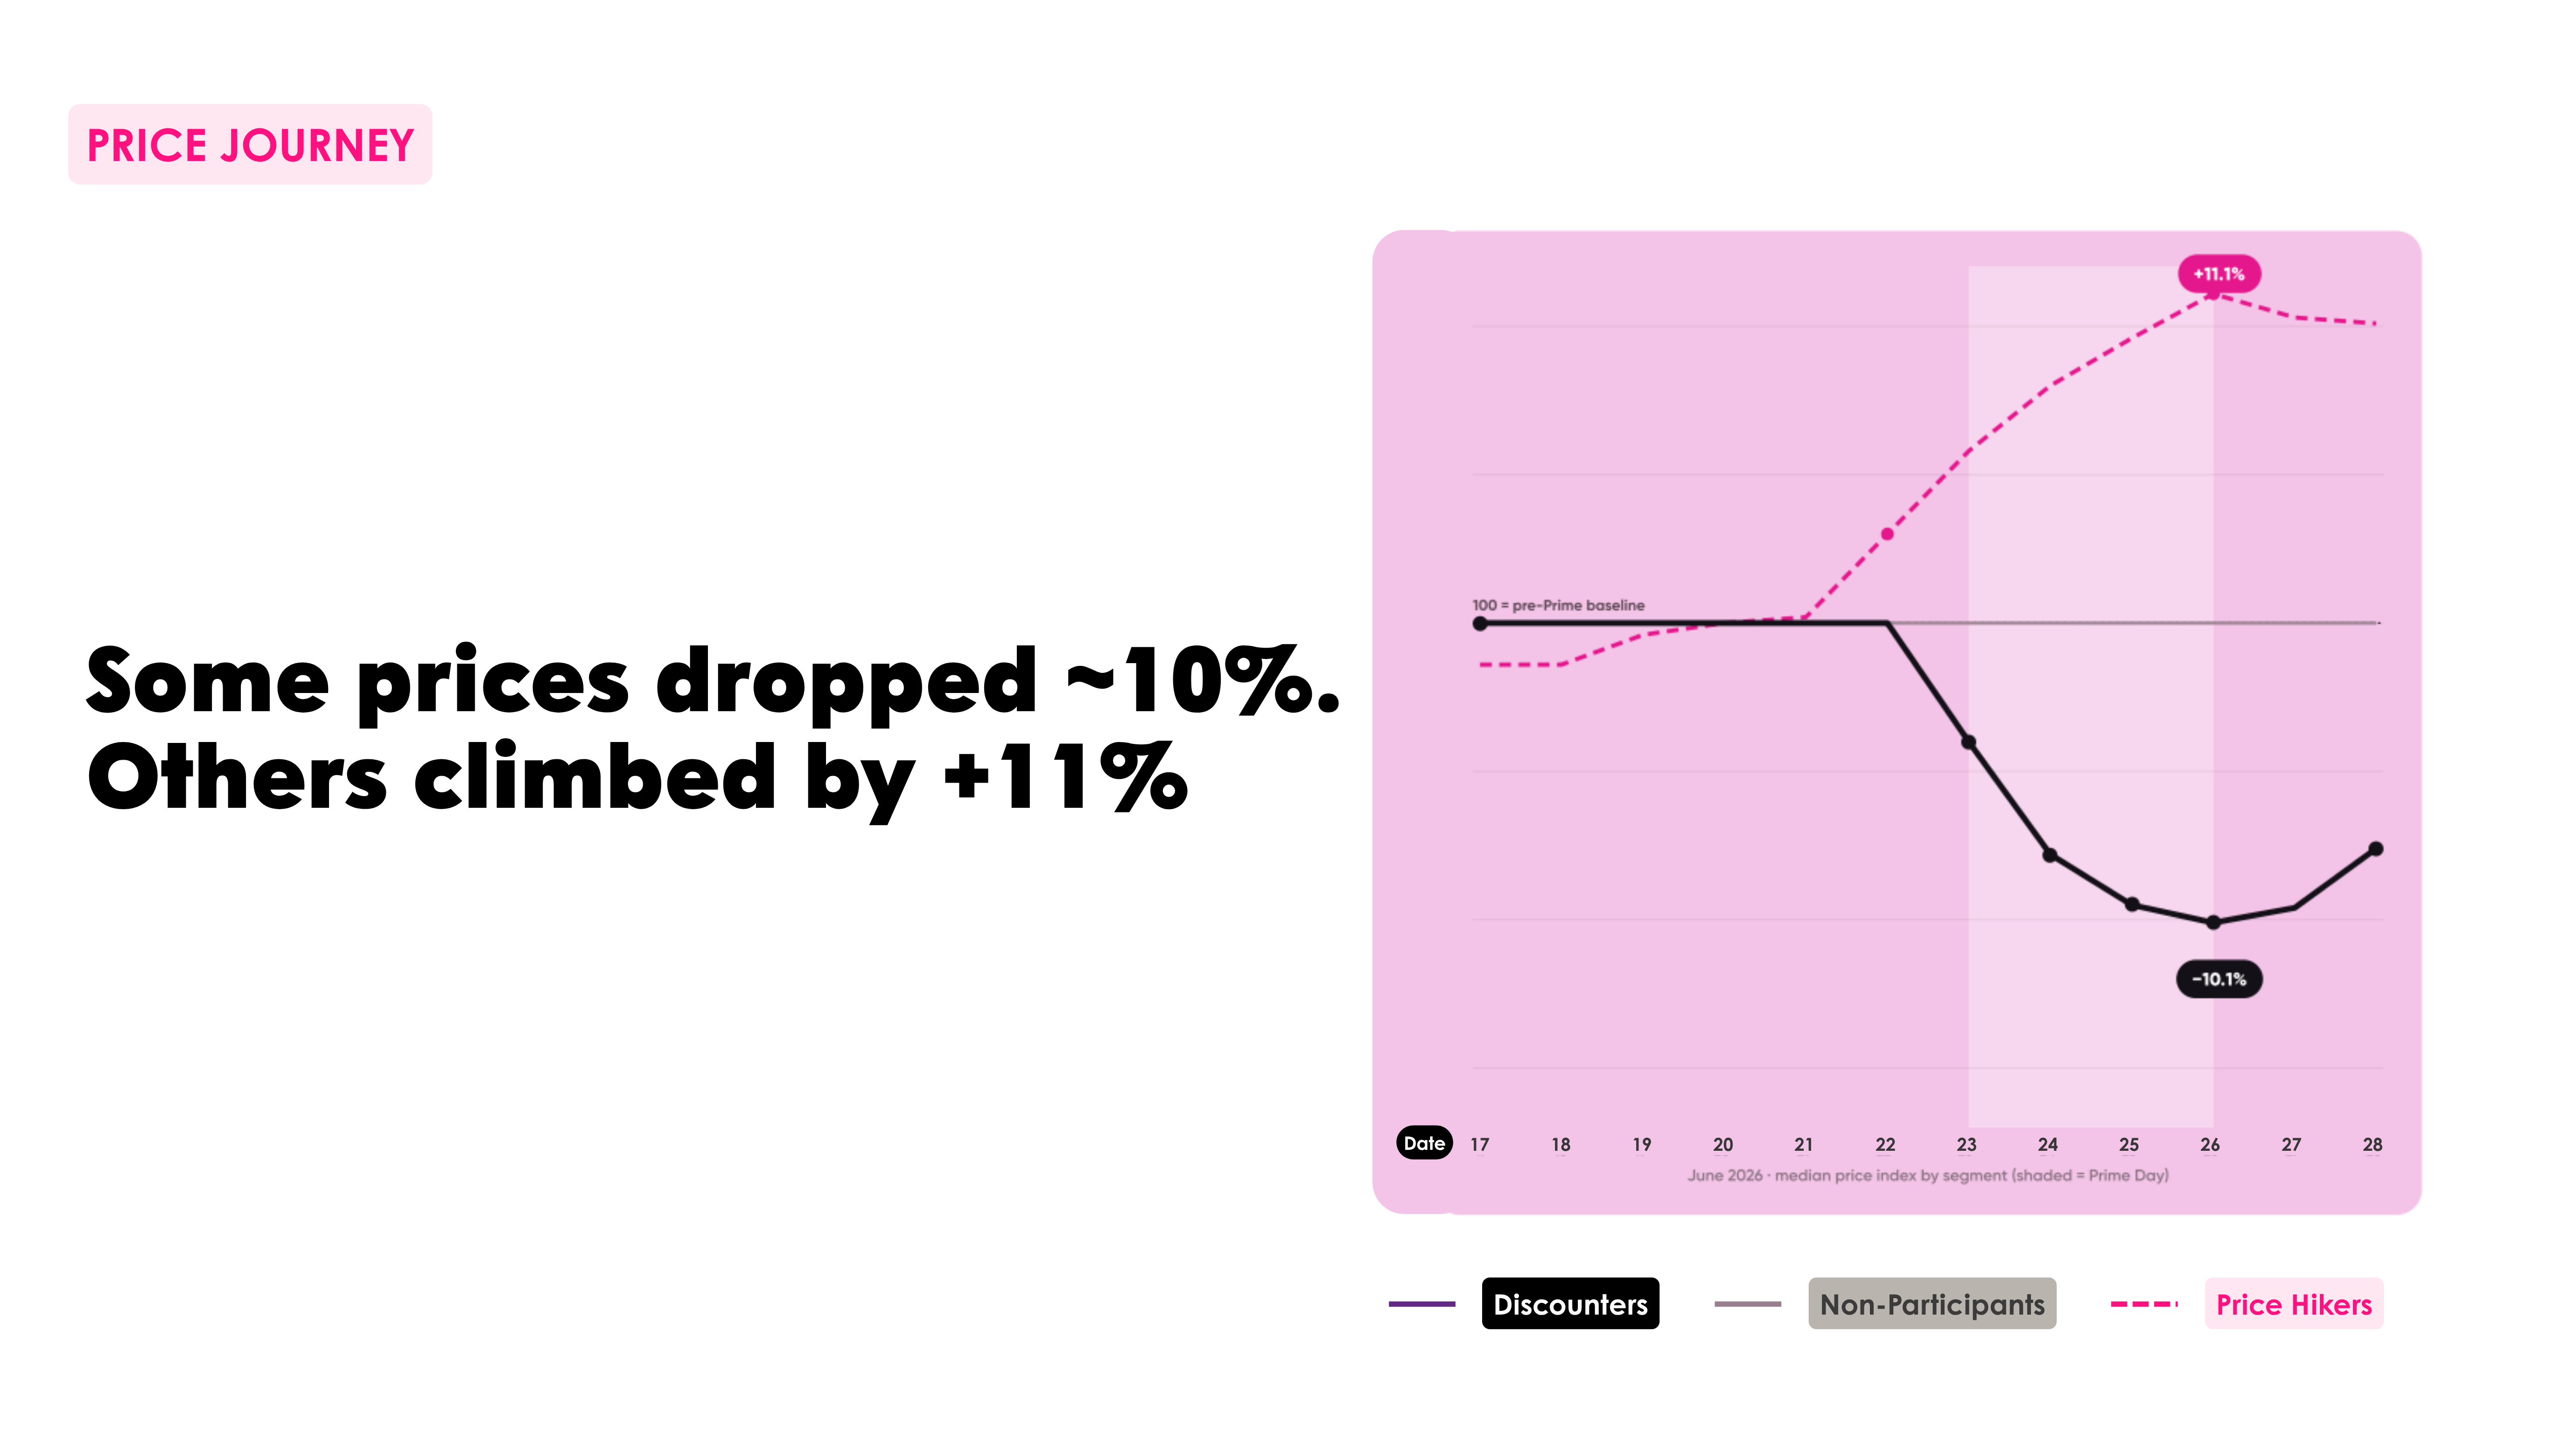
Tracking median price by segment from June 17 to 28 tells the clearest version of this story. Non-participants sat flat on their baseline the entire time. Price hikers climbed steadily from before the event and peaked at +11.1% around Prime Day itself. Discounters dropped, bottoming out at -10.1% during the event window, before drifting back upward in the days after.
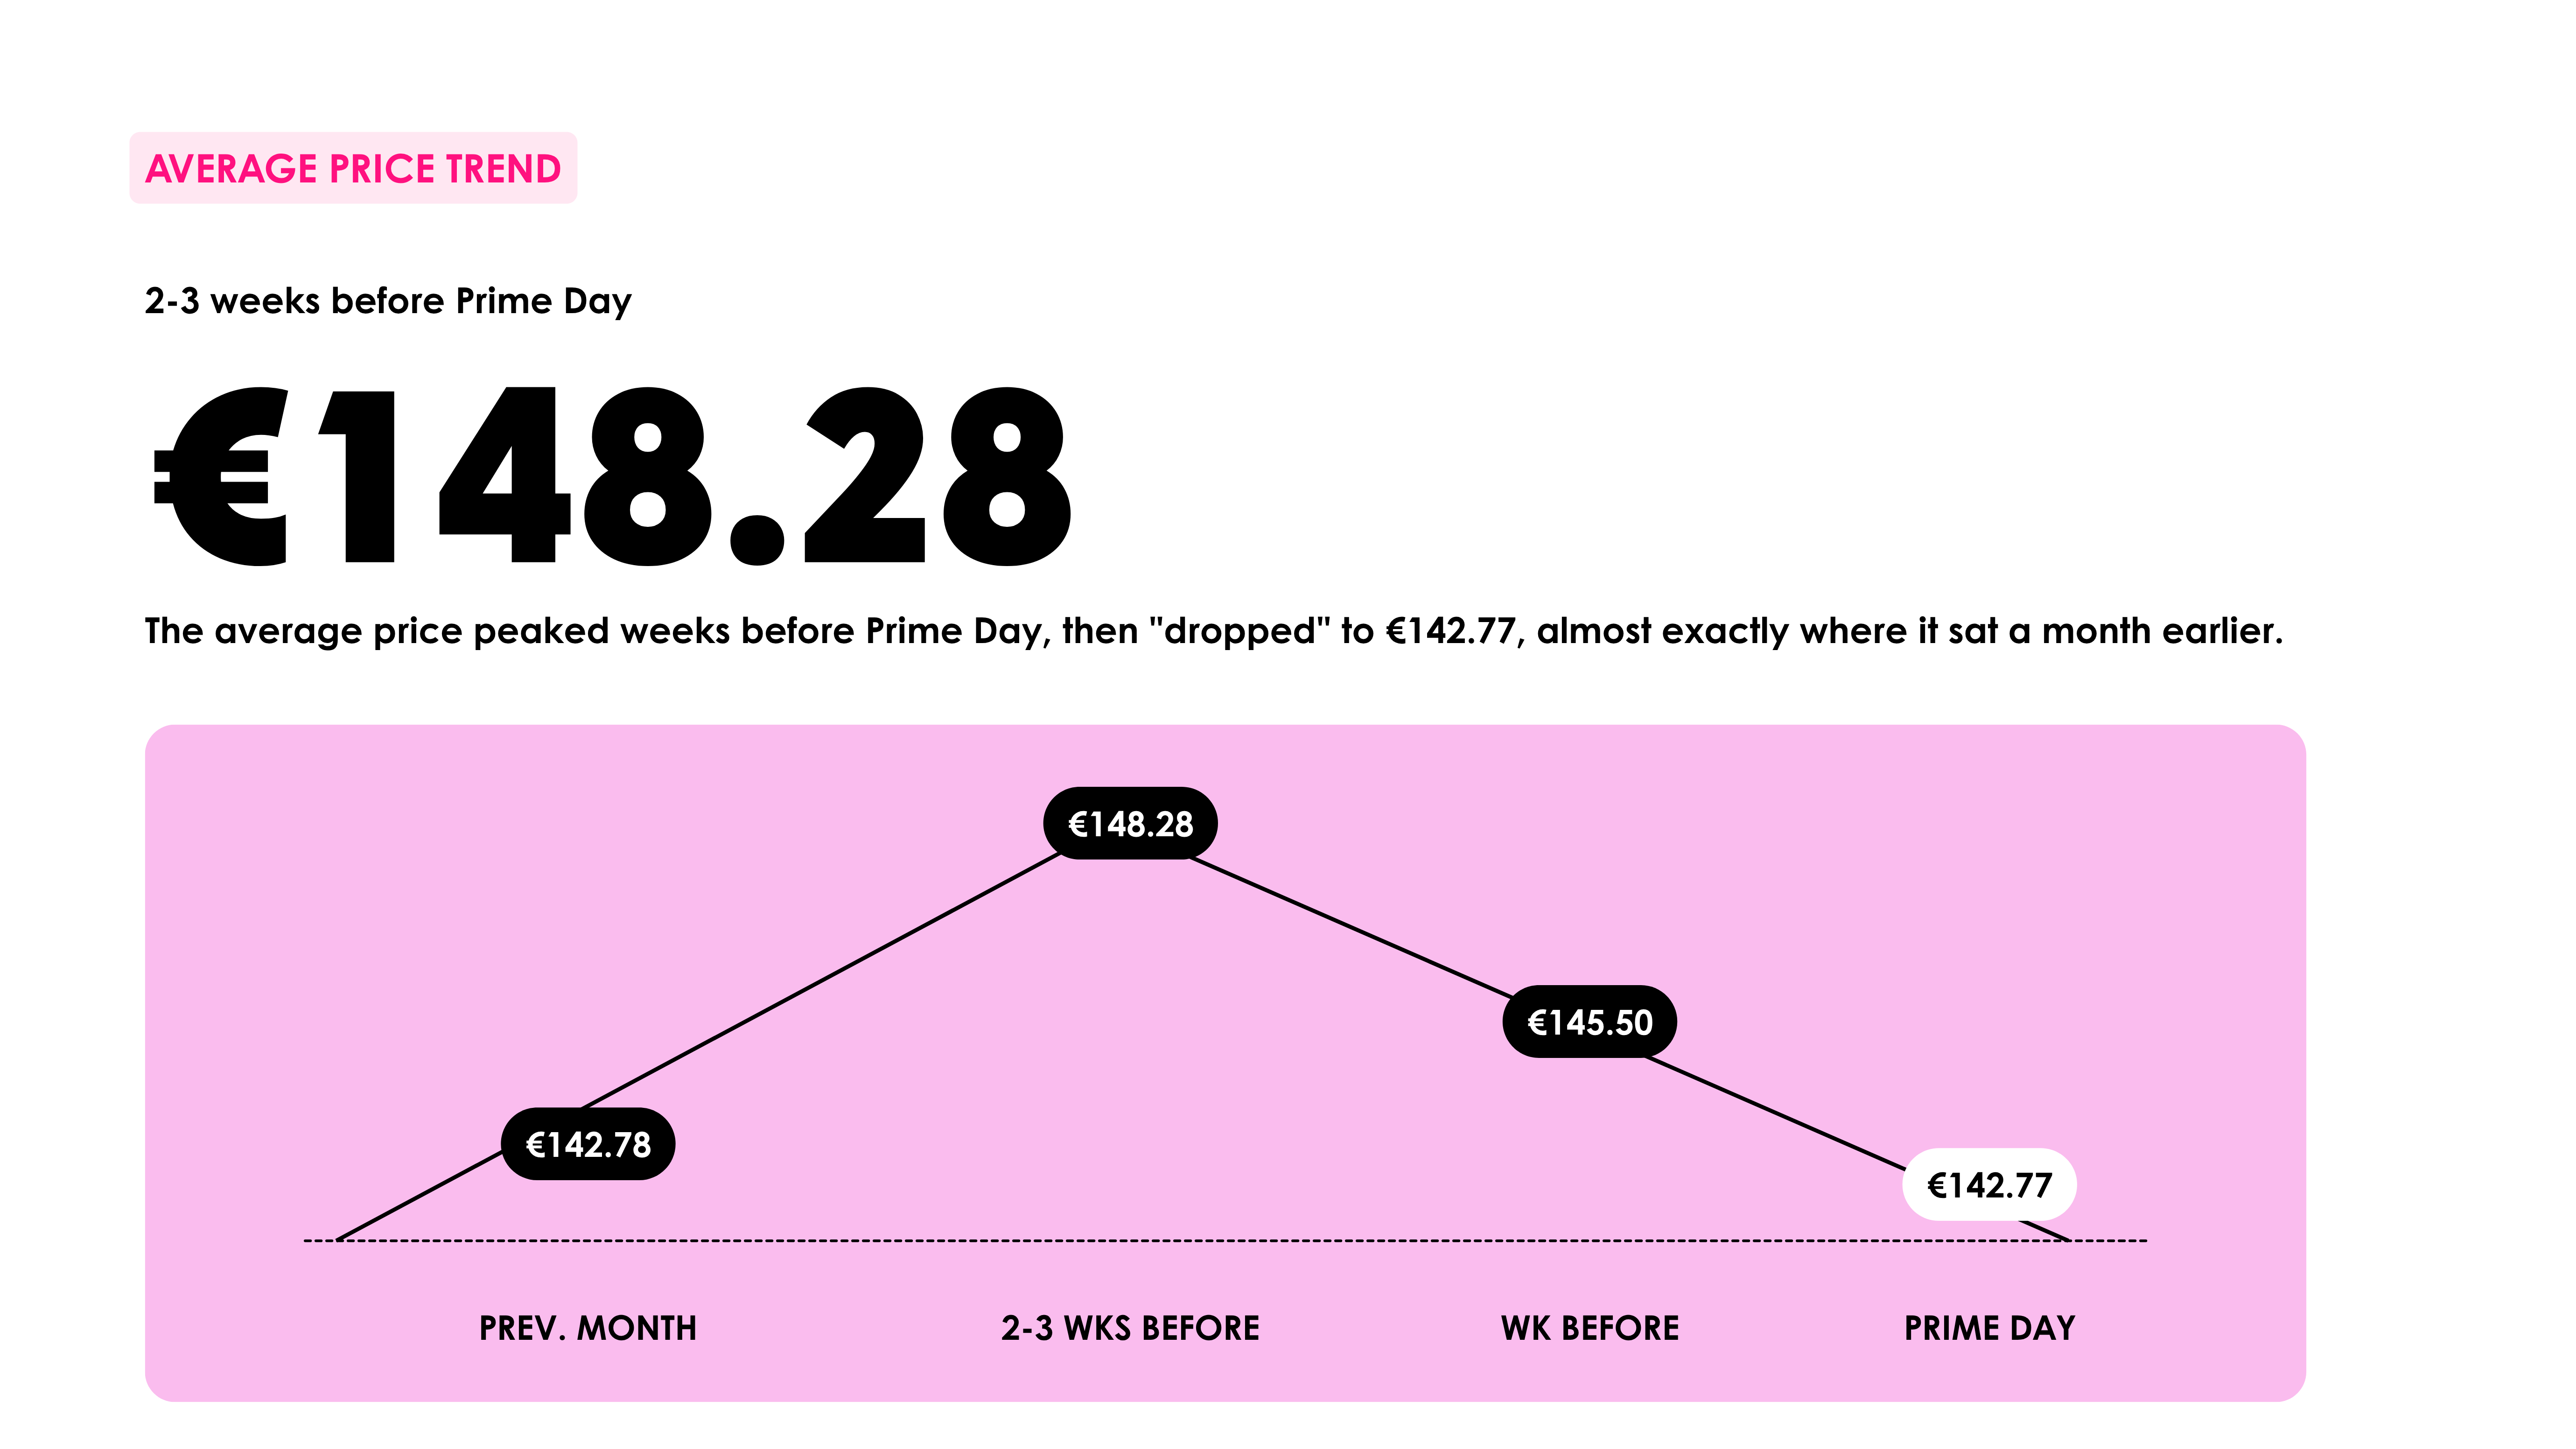
The 2025 data shows the same pre-event pattern, just in euros instead of an index. Average prices climbed from €142.78 the month before Prime Day to €148.28 two to three weeks out, eased to €145.50 the week before, then landed at €142.77 during the event itself. Almost exactly back where they'd started a month earlier.
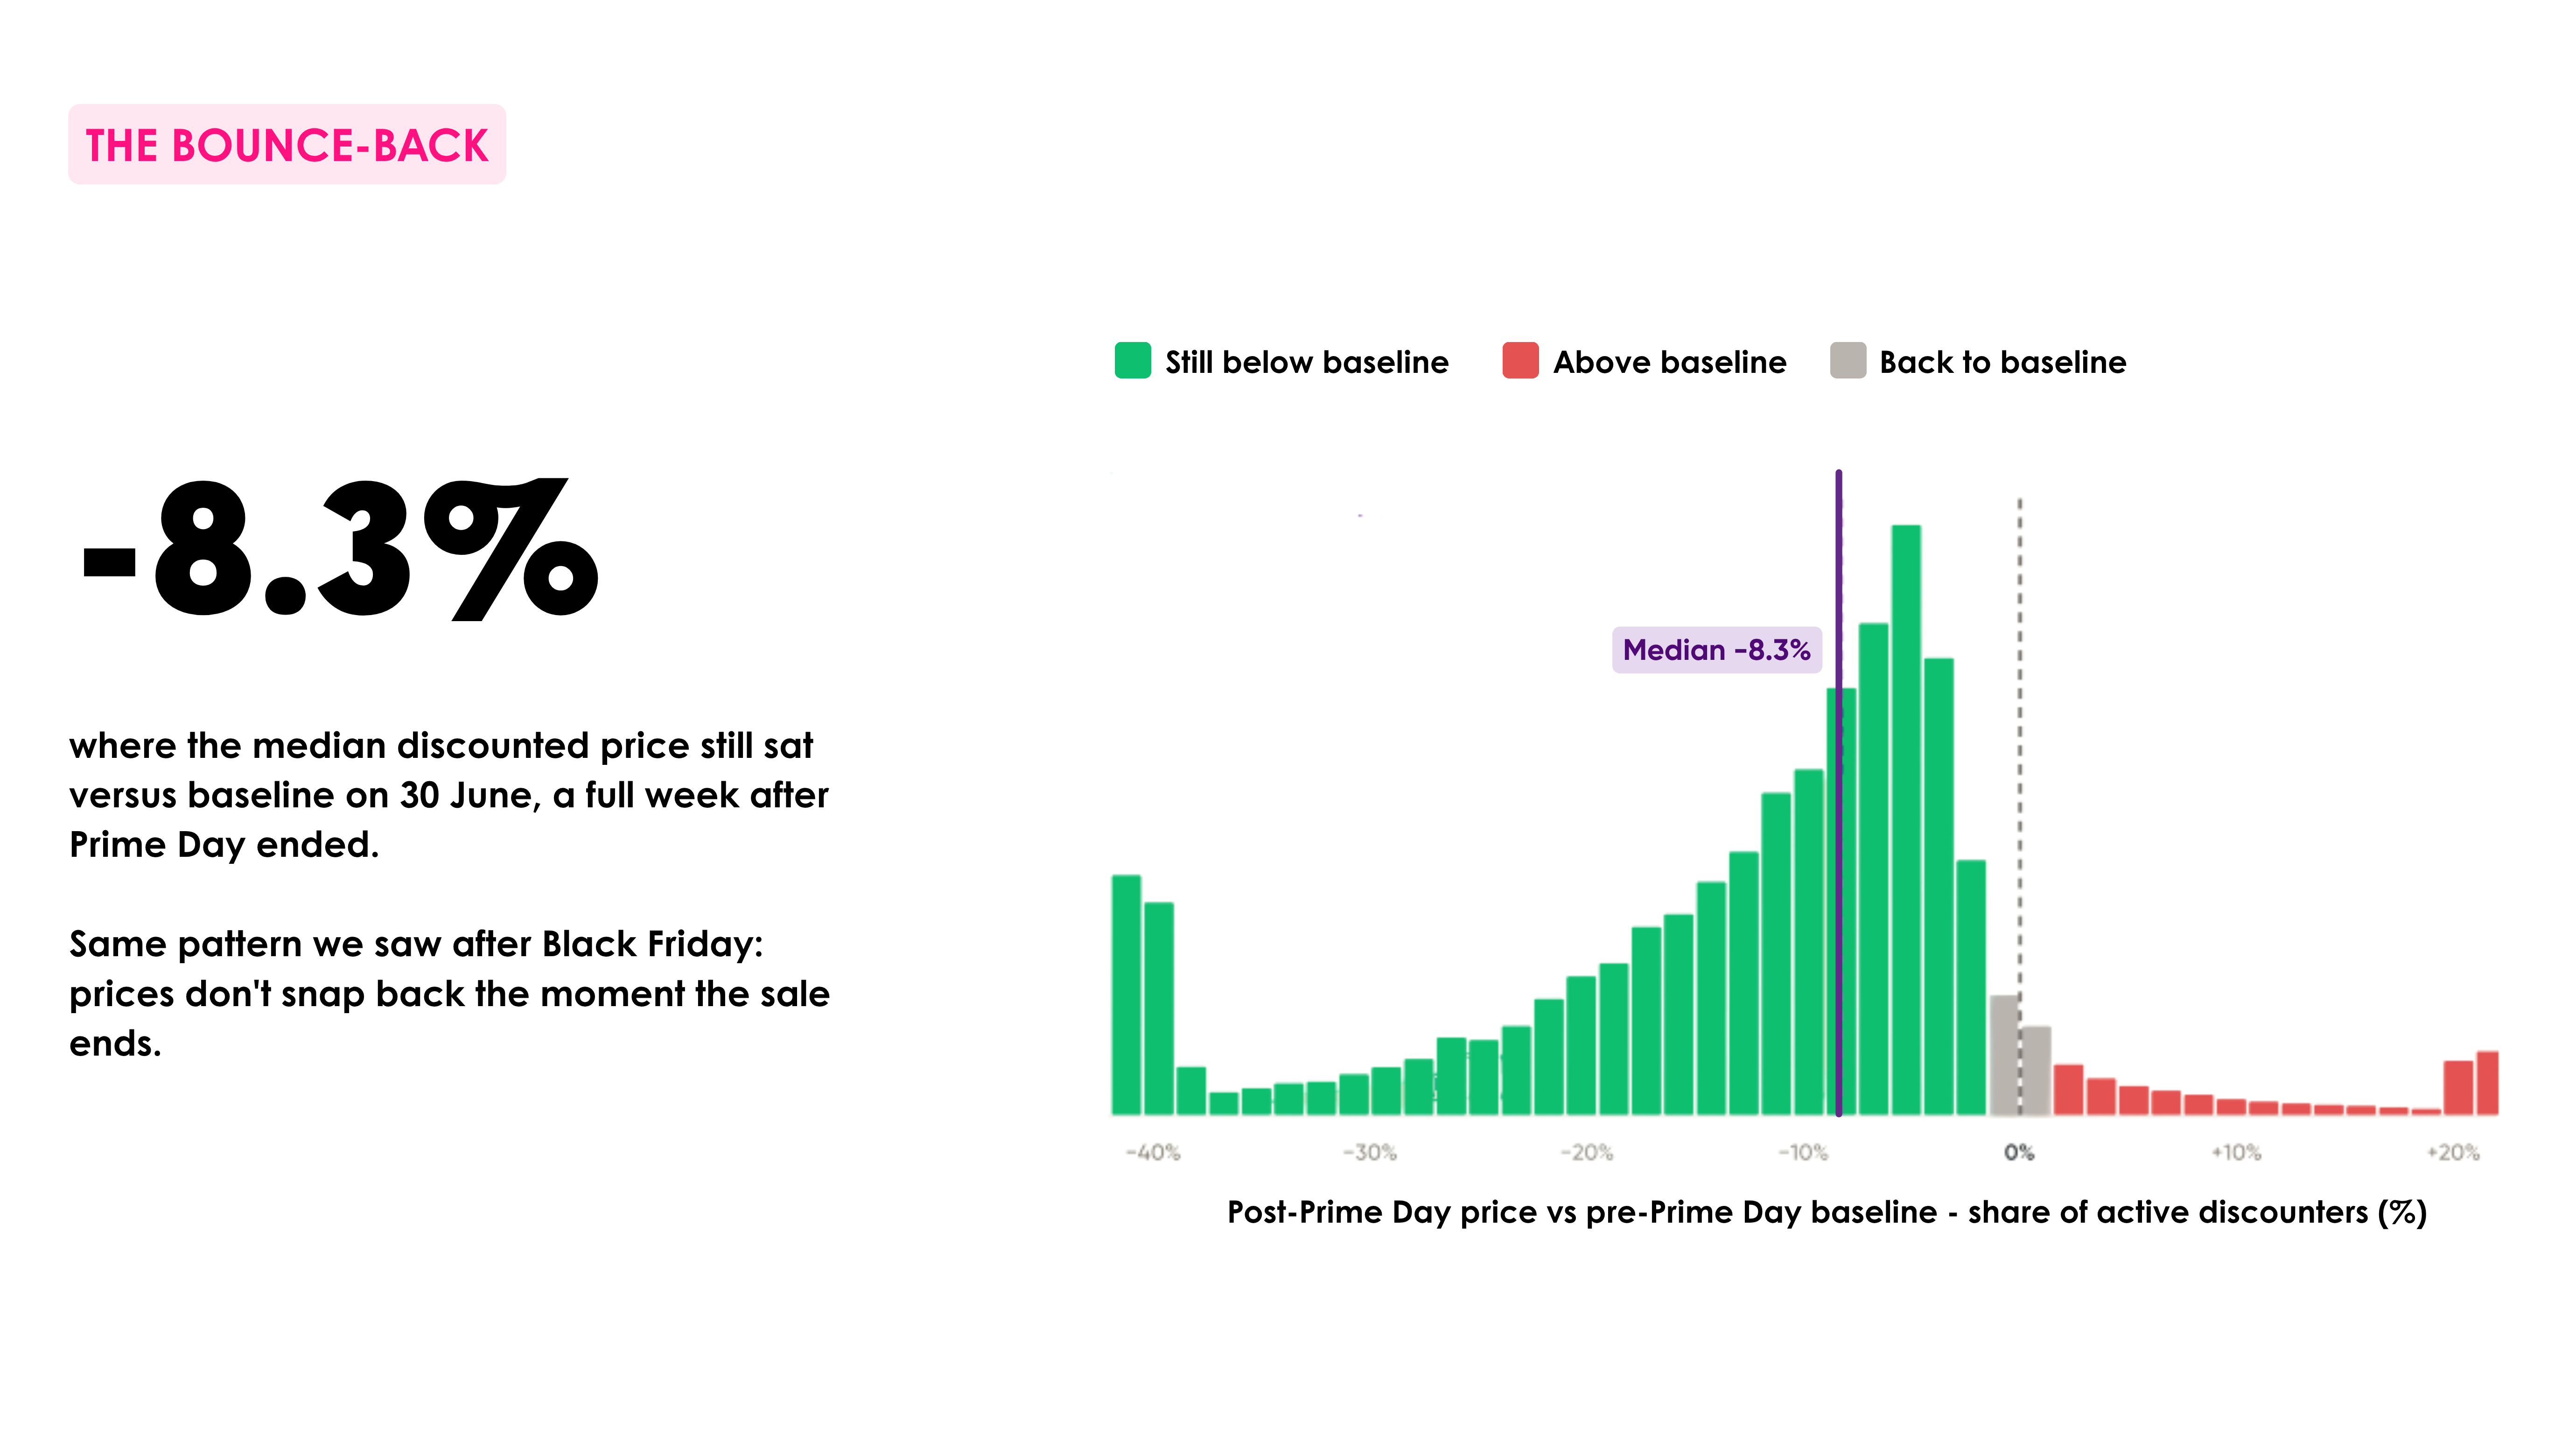
Prices didn't snap back immediately once the event ended, either. A full week after Prime Day, on 30 June, the median discounted price among active discounters was still 8.3% below its pre-Prime baseline. We saw the same pattern after Black Friday: discount depth decays slowly, not overnight.
Cheap products got discounted less often, but harder
Break participation down by price bracket and the €50-100 range had the highest share of discounted products, at 15.6%. But the deepest median cut, -8.7%, showed up at the bottom of the range, in the €0-10 bracket. Every bracket above €500 saw both lower participation and shallower cuts, bottoming out at -6.1% median discount for products over €1,000.
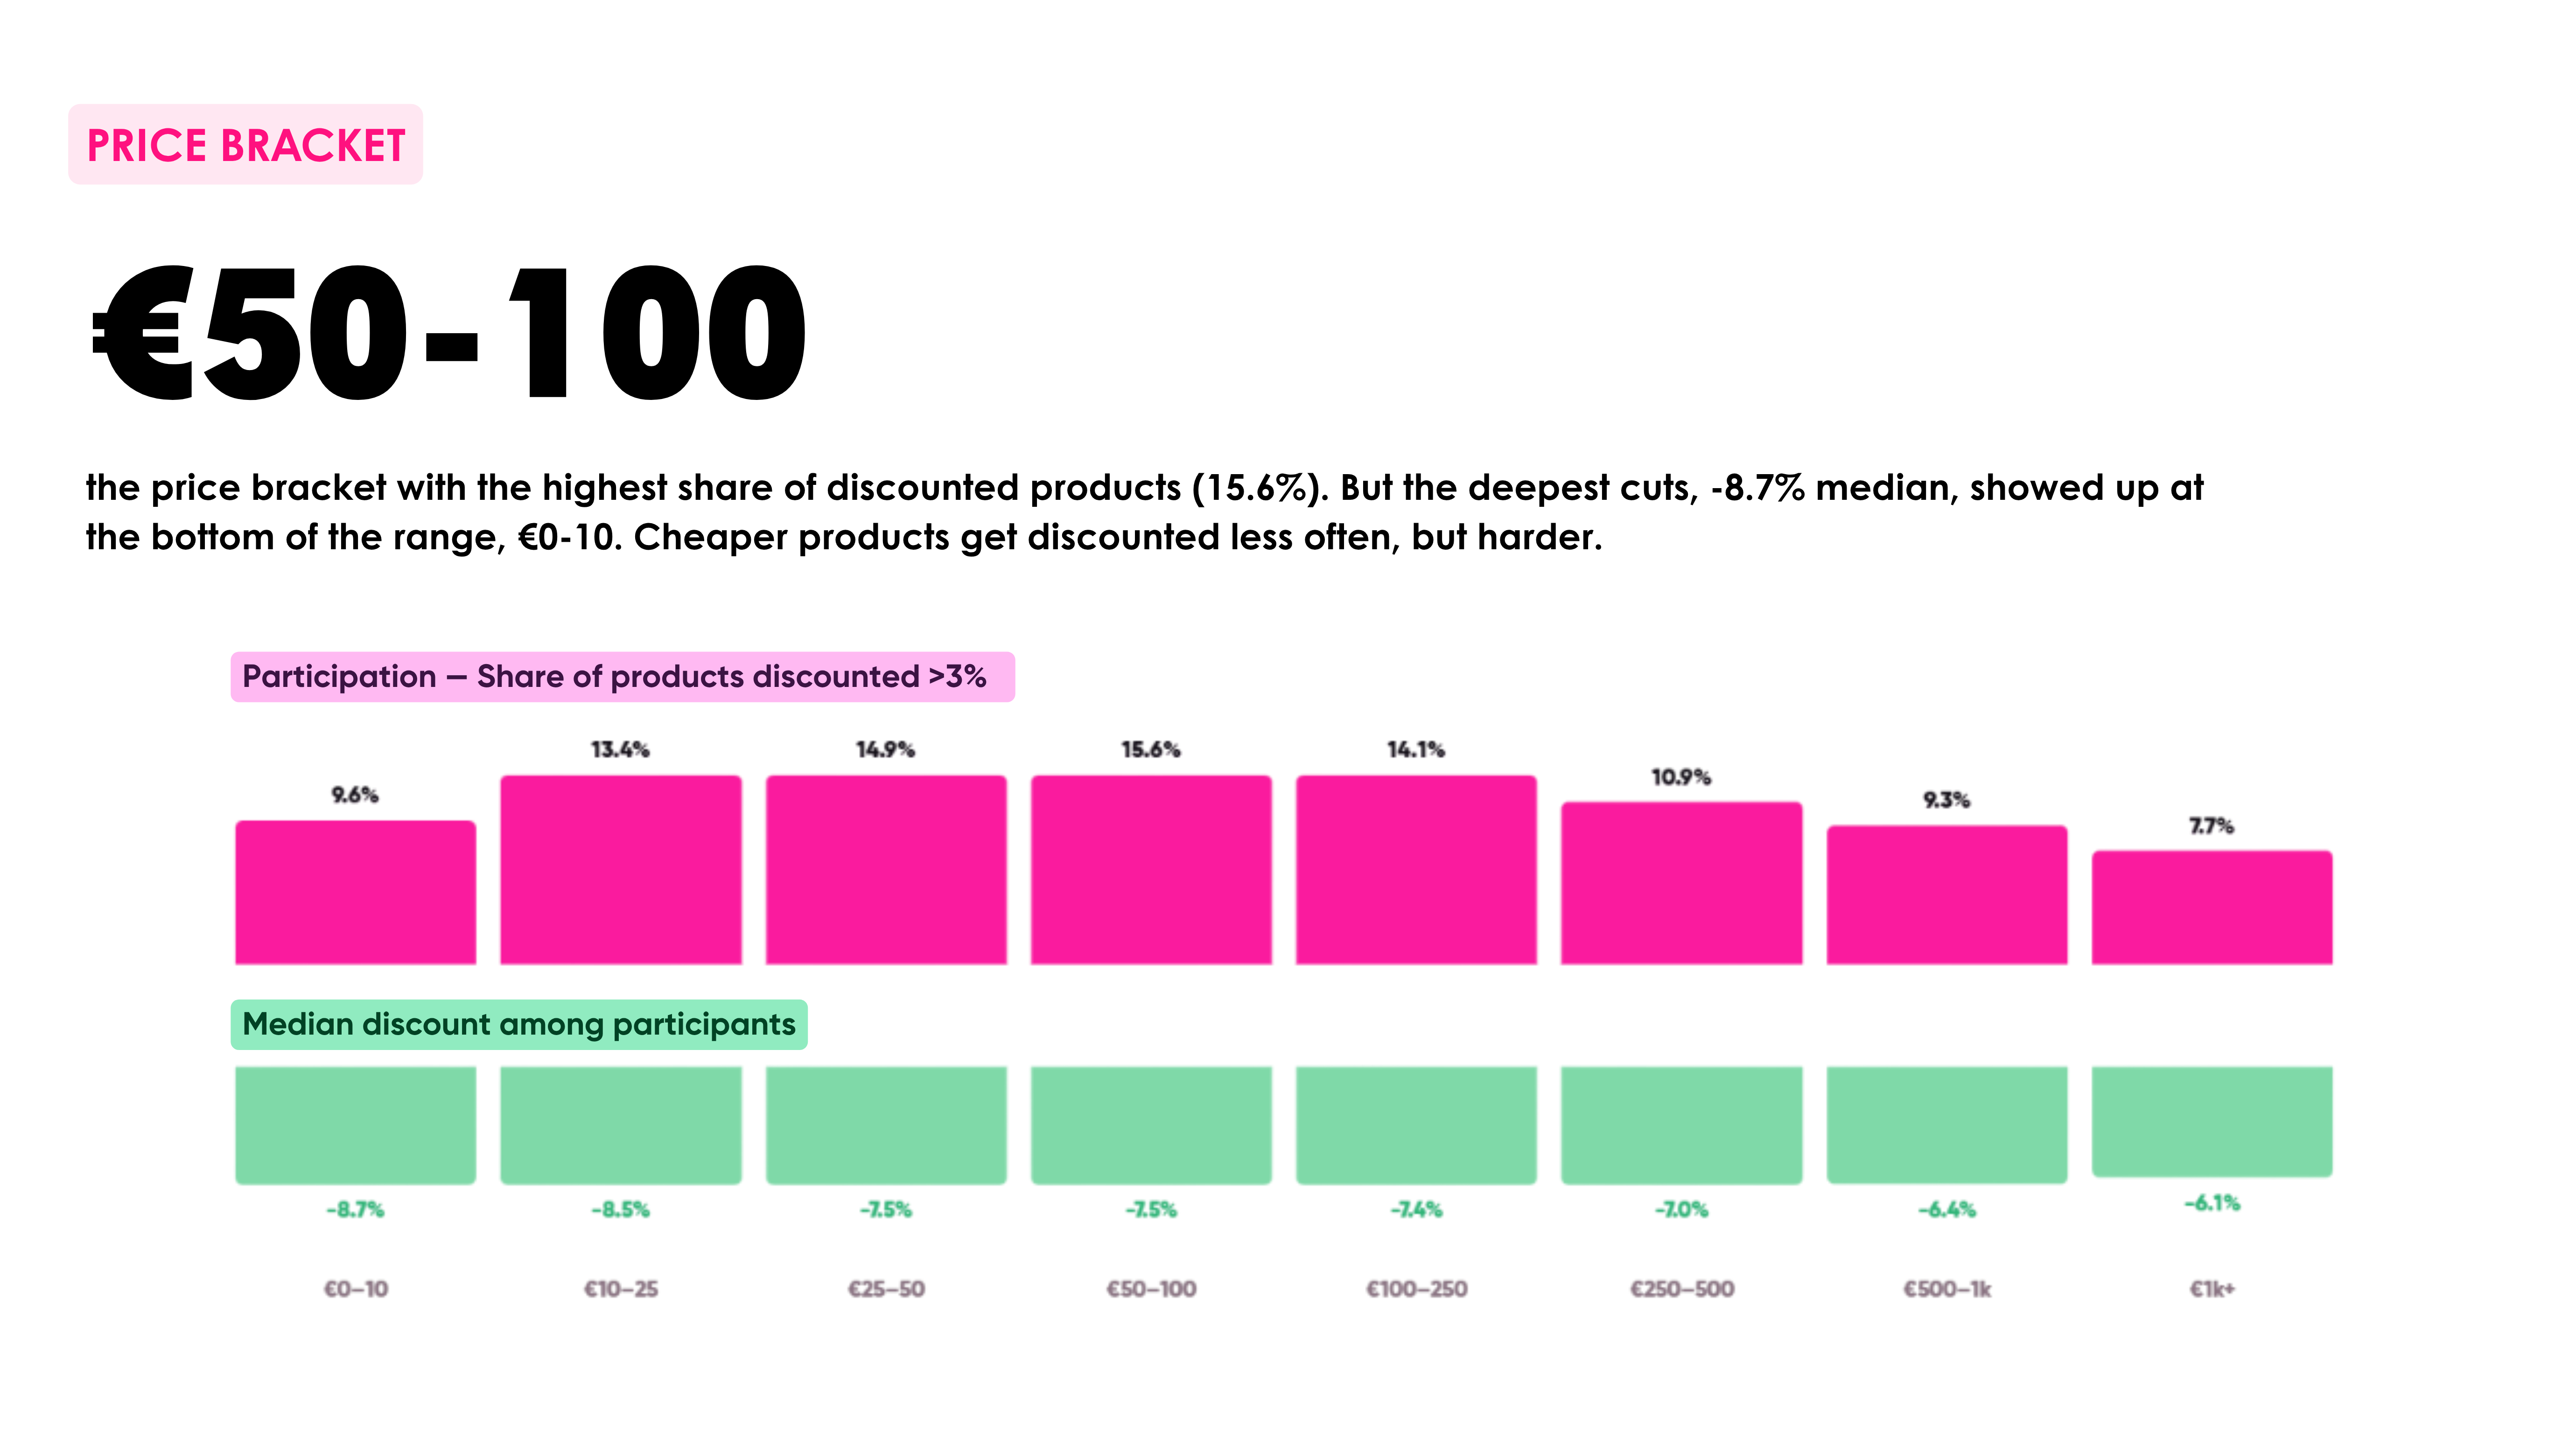
Read the two charts together, and a pattern emerges: retailers discount mid-priced, high-traffic items most often, but reserve their steepest percentage cuts for the cheapest SKUs in the catalog, the ones where a deep percentage cut still costs the least in absolute euros.
In the Netherlands, only bol.com really matched the deals
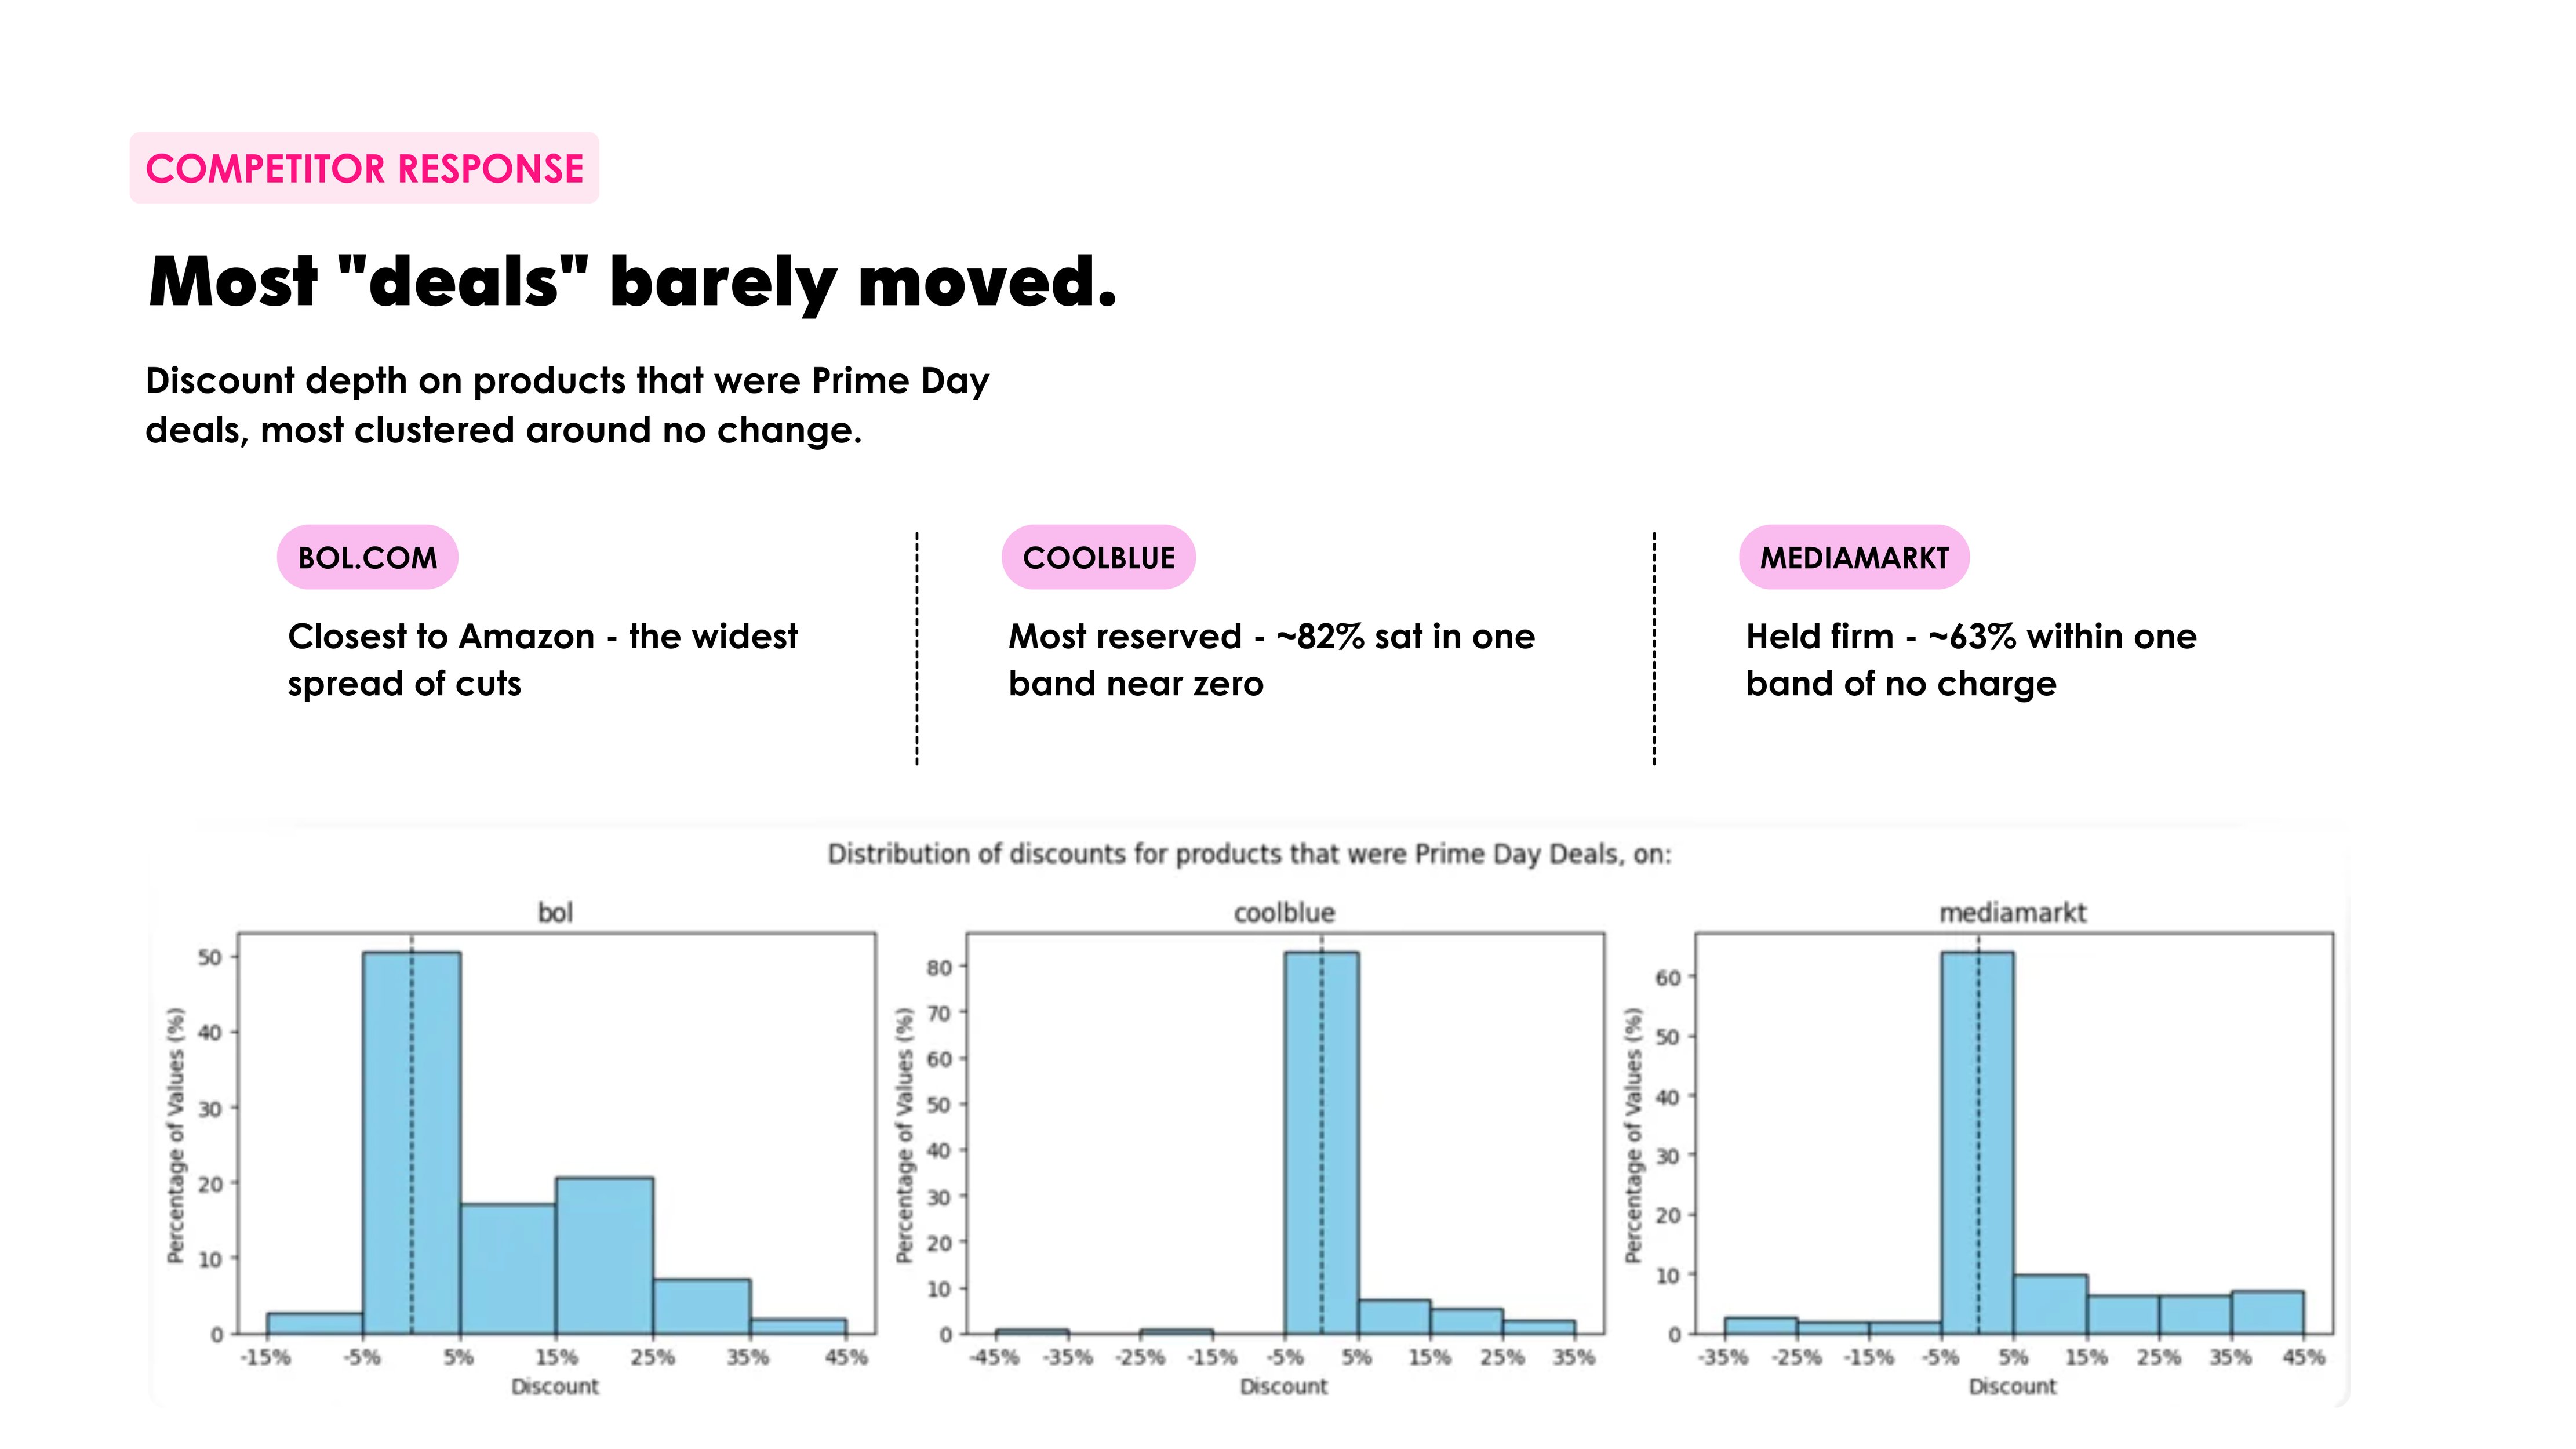
For the same products discounted on Amazon, we tracked how MediaMarkt and Coolblue responded. Both mostly held their prices flat. bol.com was the exception, with a distribution of price changes that clearly mirrored Amazon's discounting on the same SKUs.
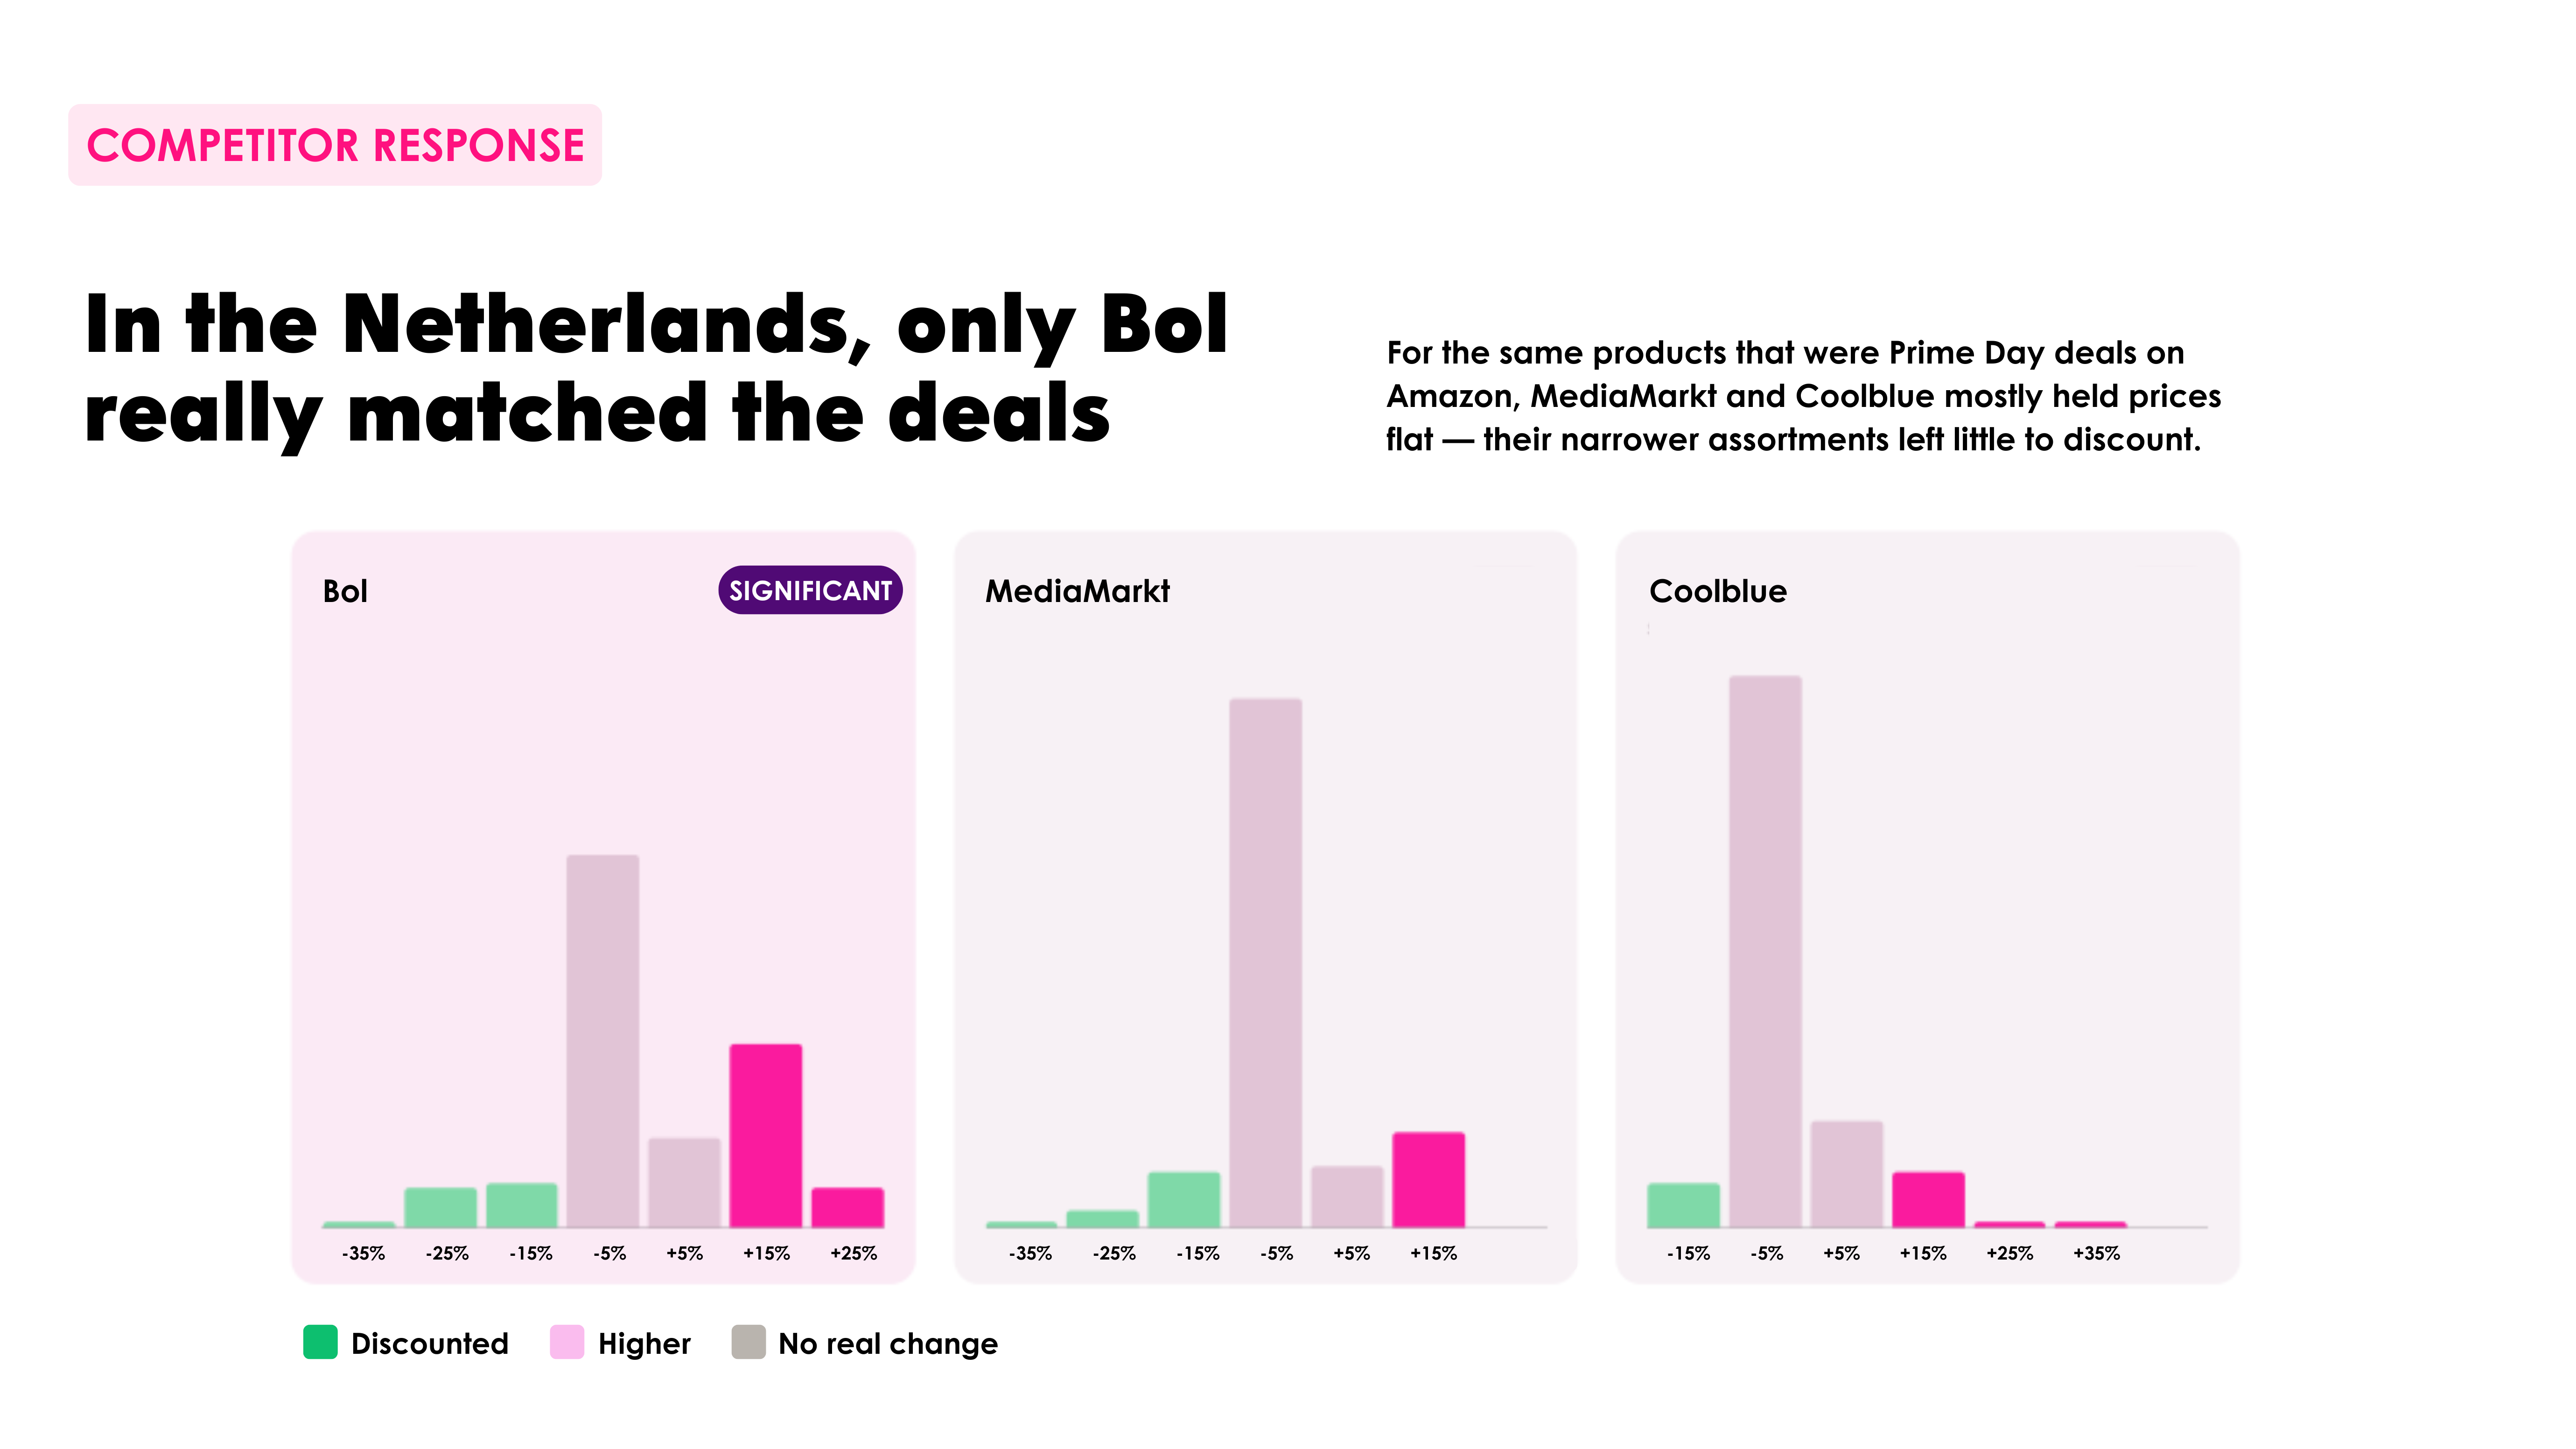
That's a shift, though a smaller one than it first looks. Even in 2025, most competitor "deals" barely moved: around 82% of Coolblue's matched discounts and 63% of MediaMarkt's sat within a single narrow band of no real change. bol.com already had the widest spread of cuts of the three. What's changed is the minority that used to break from that pattern. Last year, MediaMarkt beat Amazon's discount outright on 16% of matched products, and bol.com undercut Amazon on 14%. This year, that minority activity seems to have concentrated almost entirely in bol.com, while MediaMarkt and Coolblue's narrower assortments left them with even less to discount against. Worth flagging that the two years used different measurement approaches, so the percentages aren't directly stackable, but the direction holds: bol.com stayed the one Dutch retailer consistently willing to compete on price, and the gap between it and the other two widened.
Zoom out: the US topline tells a different part of the story
Our data measures price behavior. It doesn't measure demand, and the demand-side numbers out of the US market add useful context, even though they're a different market measured a different way.
Adobe Analytics put total US ecommerce spend across the four-day event at $26.4 billion, up 9.3% year over year, enough to surpass Black Friday and Cyber Monday 2025 combined. Discount depth across US retail sites ran 10-24% off list price, with electronics leading at 24%.
But Numerator's household panel tells a more complicated version of that same event. Average household spend fell to $143.45, down from $156.37 in 2025, and the average price per item sold dropped to $23.23 from $24.59. Consumer satisfaction with the deals themselves also slipped to 59% from 68% the year before. Record topline spend, driven partly by cheaper, more frequent purchases of everyday items like pet treats and protein shakes rather than aspirational big-ticket electronics. Adobe separately found the share of premium electronics purchases jumped, so the two data sets aren't contradicting each other so much as describing two different shopper behaviors happening at once: some traded up, many more just stocked up on essentials.
Impact Analytics reported a related pattern on the supply side: Amazon went into the event with fewer pre-event markdowns than in 2025, then delivered a within-event discount depth lift of 17 percentage points, more than double last year's jump. Hold prices, then concentrate the cut into the event window itself. That's consistent with what our own European price-journey data shows.
The new variable: AI is already shopping on Prime Day
One genuinely new data point this year: traffic to US retail sites from generative AI tools nearly doubled year over year during the event's first 24 hours, and that traffic converted 50.7% better than traffic from other sources. It's still a small slice of total traffic next to paid search, but it's the first Prime Day where AI-driven price comparison shows up as a measurable channel rather than a hypothetical one. Worth watching next cycle, since it's a live test of how AI agents handle promotional pricing signals like strikethrough prices and "was/now" claims.
The other wrinkle for pan-European retailers: Your own marketplace competes with itself
Amazon runs Prime Day across nine European storefronts simultaneously, each with its own promotional calendar. The result, as one price-tracking analysis pointed out, is that the same product can show 25% off in Germany and 12% off in the UK at the same moment. VAT rates alone range from 19% in Germany to 25% in Sweden, and Amazon's per-market discounting strategy adds another layer on top. For brands selling across multiple EU marketplaces, Prime Day isn't one event with one price. It's nine, running at once, each one benchmarkable against the others in real time.
The compliance layer hasn't gone away
Two of the 1.19 million products we tracked fall into a category worth watching closely: the 11.6% that got more expensive during the event window. Under the EU's Price Indication Directive (the "Omnibus" rules), any advertised discount has to reference the lowest price charged in the preceding 30 days, not an inflated pre-event price. Enforcement hasn't slowed down. Dutch, Belgian and Spanish authorities have already issued fines under these rules, including a combined €621,000 across five Dutch companies. Any retailer whose "Prime Day price" was quietly raised in the weeks before the event, then advertised against that inflated figure, is building exactly the kind of pricing history regulators are now actively checking for.
The pattern across two years
Two Prime Days, two different measurement windows, and the same underlying shape: a small, genuine discounting core surrounded by a much larger group of products that never really moved, plus a persistent minority that got more expensive rather than cheaper. Combine that with record demand-side numbers out of the US and slipping deal satisfaction from actual shoppers, and Prime Day's biggest tension isn't between Amazon and its competitors. It's between how the event gets reported and what happens to the price tag itself.