60,000 Products, Six Weeks, Two Countries
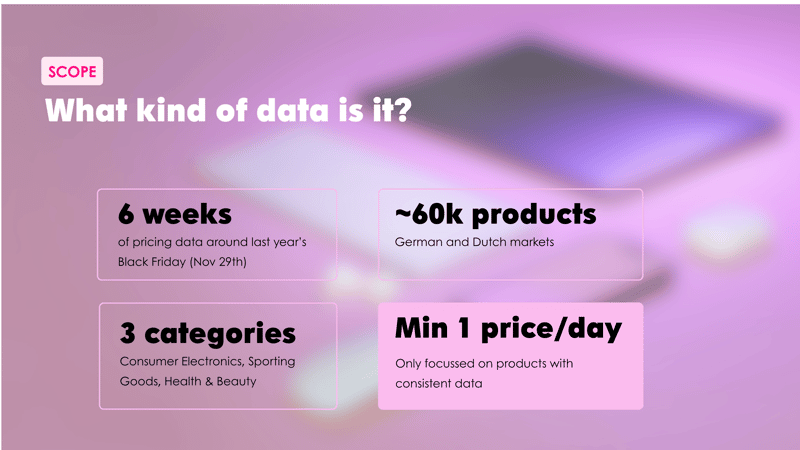
Six weeks of pricing data around last year's Black Friday (November 28), covering roughly 60,000 products across the German and Dutch markets: Consumer Electronics, Sporting Goods, and Health & Beauty. Only products with consistent daily price tracking were included.
Black Friday Discounting Starts Weeks Earlier Than Teams Plan For
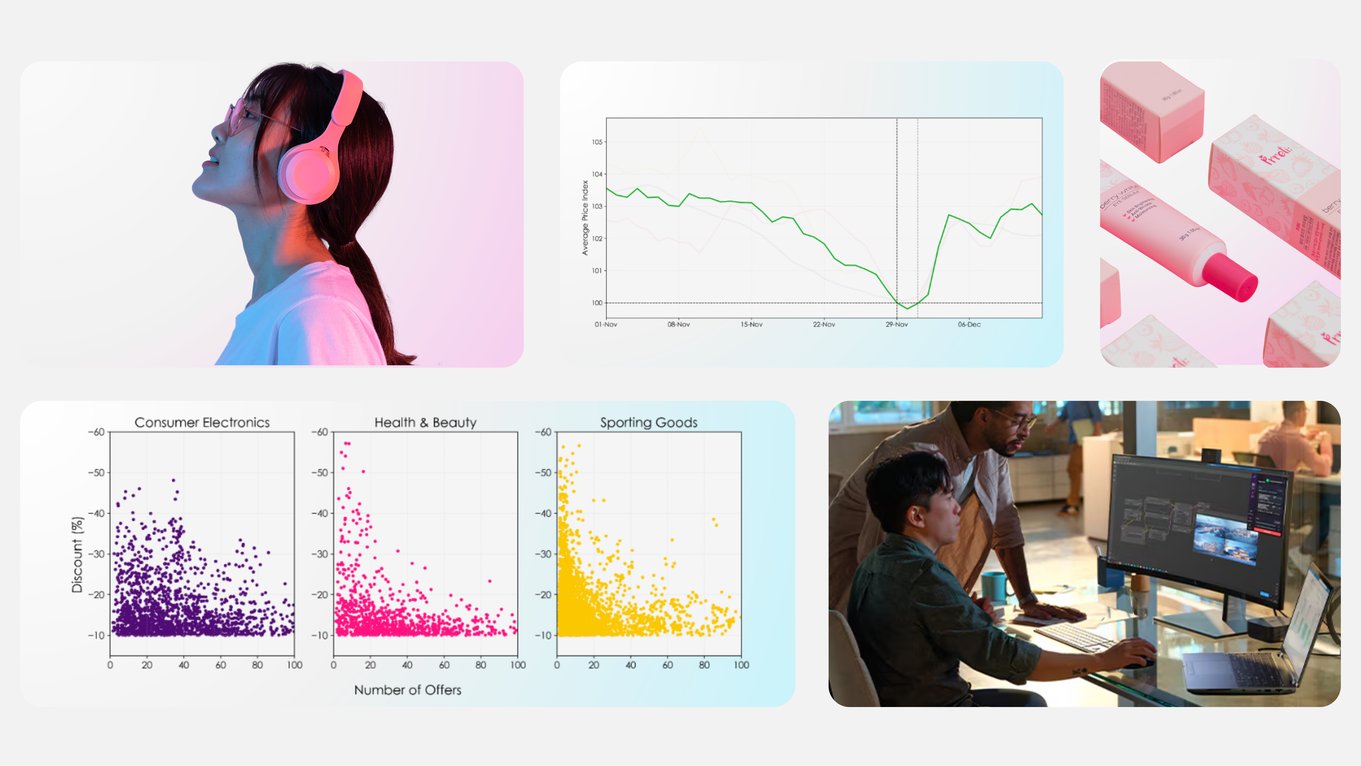
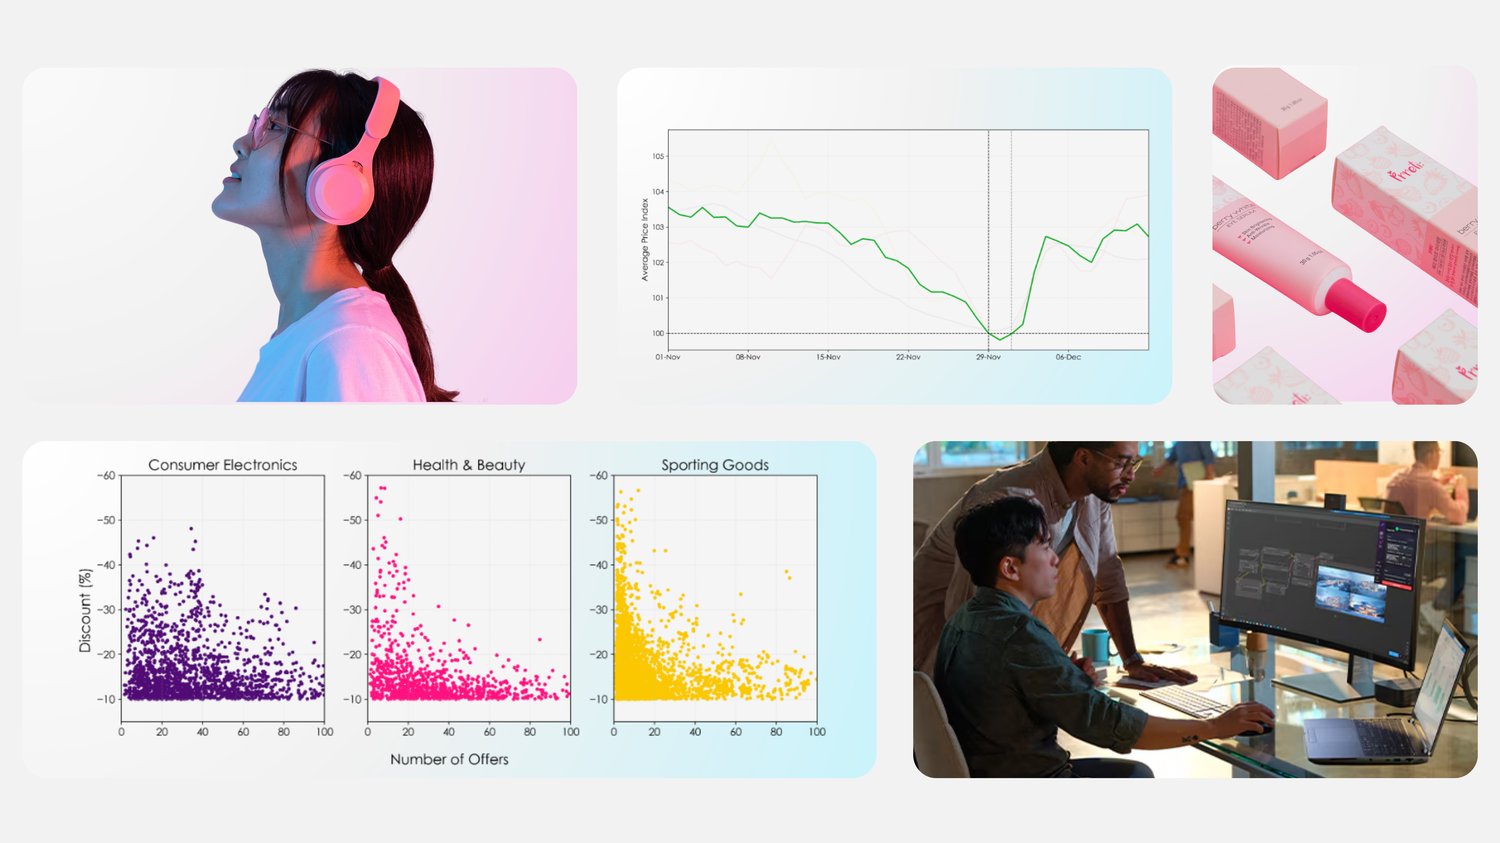
The overall price trend (indexed to 100 on Black Friday itself) shows prices declining steadily from the very start of the six-week window, not just in the final days. By Black Friday, the index bottoms out at 100, before recovering sharply, climbing back to roughly 102-103 within about a week, with the bulk of that recovery landing right around Cyber Monday.
.png?width=801&height=450&name=Black%20Friday%202025%20Recap%20(1).png)
The practical read: if your pricing strategy only kicks in the week of Black Friday, you're already behind where the market has been moving. We've seen a similar pre-event pattern around Amazon Prime Day too.
Sporting Goods Prices Spike Before They Crash
Split by category, the timing story gets more specific:
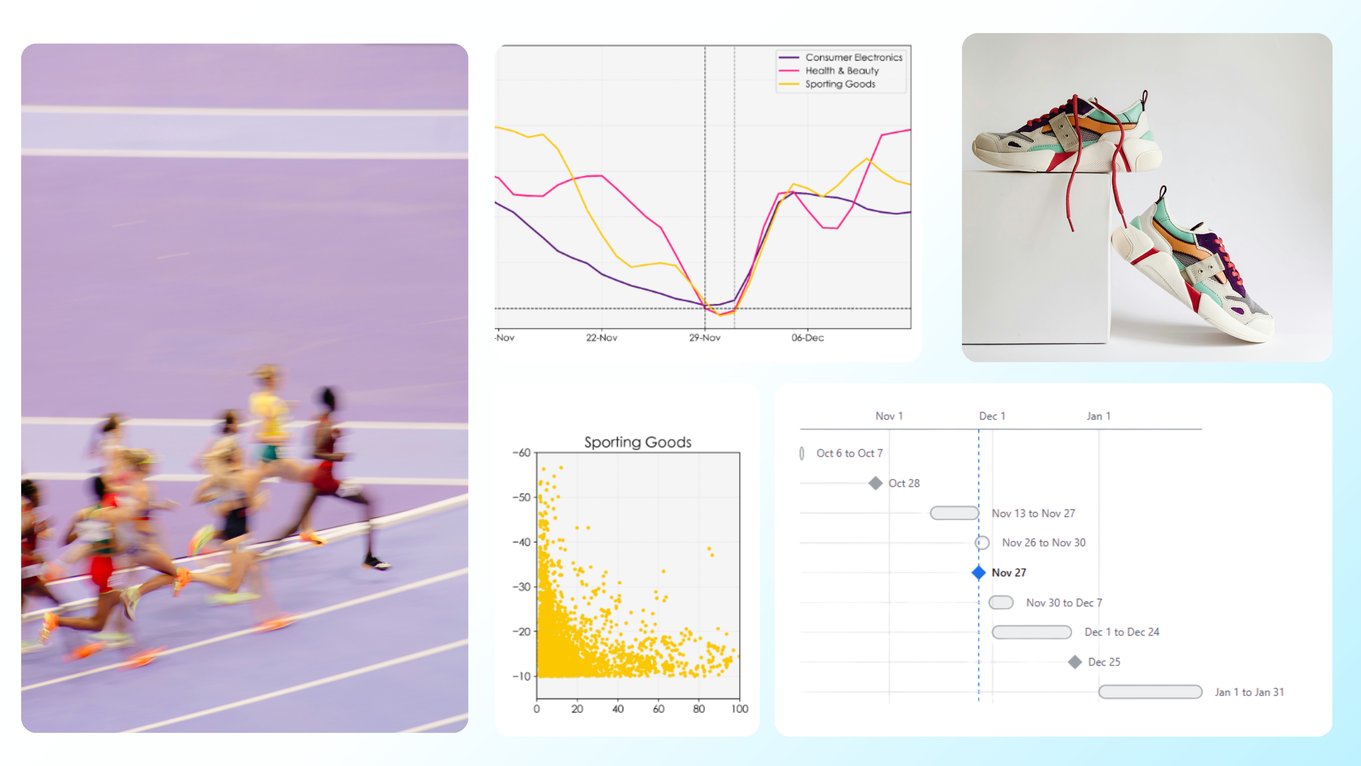
- Consumer Electronics declined the earliest and most gradually of the three, trending down steadily from the start of the window.
- Health & Beauty stayed comparatively flat for most of the six weeks, then dropped sharply in the final week before Black Friday.
- Sporting Goods did something neither of the others did: prices climbed up in the first couple of weeks of the window, peaking roughly a month before Black Friday, before dropping sharply in the final two weeks, a two-stage pattern rather than a steady decline.
.png?width=801&height=450&name=Black%20Friday%202025%20Recap%20(2).png)
All three categories converge to roughly the same point right around Black Friday itself, but they take very different paths to get there.
Cheap Products Get Discounted More, Except in Electronics
Here's where it gets more nuanced than "cheap stuff goes on sale." Looking at raw discount participation by price bracket:
- Health & Beauty: 71% of tracked products sit in the €0-50 range, and that bracket also carried a clearly higher share of discounted products than the €50-100, €100-300, or €300+ tiers.
- Sporting Goods: half the catalog sits under €50, and that segment showed a noticeably higher discount rate than pricier brackets.
- Consumer Electronics: less clear-cut. Products are more evenly spread across price brackets (37% are actually in the €300+ tier), and once you normalize for how many products sit in each bracket, the discount rate comes out fairly even across all four price ranges, no strong skew toward cheap electronics specifically.
.png?width=801&height=450&name=Black%20Friday%202025%20Recap%20(3).png)
The Steepest Cuts Also Land on the Cheapest Products
Beyond how often products get discounted, there's a separate pattern in how deep those discounts go. Across all three categories, most discounted products sit at relatively shallow discount levels, but there's a long tail stretching out to much steeper cuts (40-50%+). That tail is present in every price bracket, but the sheer number of steeply discounted products is concentrated in the cheapest tiers, especially in Health & Beauty and Sporting Goods.
.png?width=801&height=450&name=Black%20Friday%202025%20Recap%20(4).png)
More Competitors on a Product Means a Smaller Discount
The more competing offers a product has in the market, the shallower its discount tends to be. Products with dozens of competing offers cluster tightly around modest discounts, roughly 10-20%. The steepest discounts in the dataset (40-60%) show up almost exclusively among products with relatively few competing offers, the more niche end of the catalog.
.png?width=801&height=450&name=Black%20Friday%202025%20Recap%20(5).png)
Read together with the price-tier pattern above, there's a rough logic here: heavily-shopped, heavily-compared products get smaller, more cautious cuts. Niche products, with less competitive scrutiny, have more room to move. Worth keeping in mind too: steep, fast-moving discounts like these are exactly the kind of thing that draws regulatory scrutiny under the EU's Omnibus Directive, so it's worth checking any deep Black Friday cut against your own 30-day price history before it goes live.
Four Things to Do With This Before Black Friday 2026
Four practical takeaways, pulled directly from the analysis:
- Prepare early. Some categories start moving prices more than two weeks out, and Cyber Monday matters too, don't treat Black Friday as a single-day event.
- Category-level patterns hide a lot. Consumer Electronics, Health & Beauty, and Sporting Goods all behave differently enough that a blanket strategy across categories leaves value on the table. (For more on building category-specific pricing strategies, see our full strategy breakdown.)
- Price tier matters, but not equally everywhere. It's a real, strong effect in Health & Beauty and Sporting Goods. It's a much weaker effect in Consumer Electronics.
- Competitive intensity and discount depth move in opposite directions. More competition on a product tends to mean smaller cuts, not bigger ones.
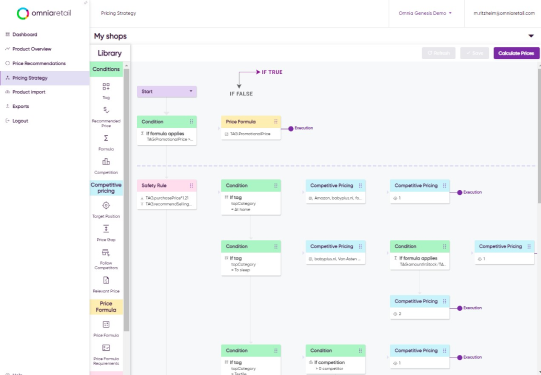
For the practical side of turning these patterns into an actual pricing setup, from version-controlled strategy trees to approval workflows, see our companion piece: Maximising Black Friday Impact: Strategic Pricing for E-commerce Retail.
.png?width=801&height=450&name=Black%20Friday%202025%20Recap%20(6).png)
Watch the full Black Friday Webinar