

Setting the right price for your e-commerce products is like playing a game with extremely high stakes, no clear rules, and ultra-intense competition. Choose the right price over time, and you can win over your target customers, creating loyal buyers who keep your business growing for years to come. Choose the wrong price and everything could go south, quickly.
So, how can e-commerce merchants choose the right pricing strategy or combination of strategies? In this comprehensive guide, Omnia covers 17 common pricing strategies in e-commerce and offers some advice for finding the right action plan for your business.
What Type of Pricing Strategies Exist?
Pricing strategies are approaches used by online businesses to determine, adjust, and maintain the prices of their products or services over time. Strategies should take into account the company’s revenue goals, production costs, and other KPIs like customer lifetime value (CLV) and average order value (AOV).
Understanding Pricing Terminology: Strategy, Tactic, and Rule
Before diving into specific pricing approaches, it's important to understand the key differences between pricing strategies, tactics, and rules, terms that are often used interchangeably but have distinct meanings in e-commerce pricing.
What is a Pricing Strategy?
A pricing strategy is the overarching, long-term approach that guides how a business positions its products in the market through price. It's the high-level framework that aligns with your business objectives and brand positioning.
Examples include premium pricing, competitive pricing, or value-based pricing.
What is a Pricing Tactic?
A pricing tactic is a specific short-term action or technique used to implement your pricing strategy. These are the day-to-day methods you use to achieve your strategic pricing goals.
Examples include:
- Flash sales and promotional discounts
- Bundle offers
- Seasonal price adjustments
- Limited-time offers
- Early bird pricing
What is a Pricing Rule?
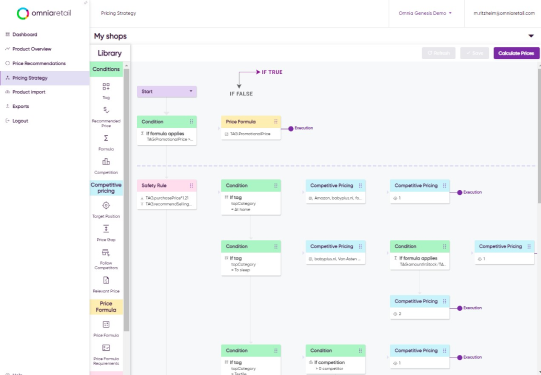
A pricing rule is the concrete, automated formula or condition that executes your strategy and tactics. It's the technical implementation that determines exactly how prices are calculated and when they change. In dynamic pricing software like Omnia, this might look like:
- Strategy: Premium pricing (position 20% above market average)
- Tactic: Maintain premium during peak season, reduce during low season
- Rule: New price = Market average price × 1.2
So, based on this rule, the price will be calculated and set to be 20% higher than the market average that day. With Omnia, this can also be combined with conditions, filters, and more. The complexity of a rule is limitless.
Why it matters:
-
Strategies guide your overarching direction
-
Tactics are used to boost results in specific scenarios
-
Rules are how you scale and automate those decisions consistently
By understanding this hierarchy, pricing teams can better structure their pricing architecture and ensure that every decision made aligns with long-term goals.
Many retailers today use a hybrid approach that combines rule-based logic with algorithmic intelligence. For example, you might define rules to enforce brand pricing policies or maintain a certain price gap between SKUs, while also using machine learning algorithms to optimize prices for profitability or conversion based on real-time demand signals. This balance gives teams the control they need while benefiting from automation at scale.
Top Pricing Strategies for Retail, DTC and E-commerce
There are endless examples of pricing strategies in e-commerce, so we compiled a list of 17 common types of pricing strategies below, which we grouped into four categories:
-
Psychological Pricing Strategies
-
Dynamic & Data-Driven Pricing Strategies
-
Competitive & Market-Based Pricing Strategies
-
Promotional & Launch Pricing Strategies
Psychological Pricing Strategies
These strategies tap into consumer perception, emotion, and behavioral economics.
Odd-Even Pricing
Odd-even pricing falls under the category of psychological pricing strategies and taps into the psychology of numbers to influence consumer behaviour. Odd prices, like €5.99, are commonly used, but even prices, like €6.00, have their own psychological impact. This strategy can be employed in various ways, from offering strategic discounts to trying to create a memorable price point.
For example, take a look at the difference between how luxury jewellery brand Tiffany & Co uses even pricing and more affordable brand Kay Jewellers uses odd pricing.

Customers coming to Tiffany & Co. are looking for luxury items and are likely less price sensitive, so the company uses even pricing.

Shoppers on the Kay Jewellers website may be more interested in finding a deal, so many of their prices use odd pricing and end in .99 or .95.
Charm Pricing
Charm pricing, also called psychological pricing, is similar to odd-even pricing, as it leverages pricing to evoke an emotional response and prompt action. This strategy is often observed in late-night infomercials, where potential buyers can be swayed by a price ending in “.99” or “.95” to make an impulse purchase. But infomercials aren’t the only place charm pricing is seen; many retailers use elements of this pricing strategy.
There are a number of theories for why charm pricing is so effective:
-
A perception of loss: This is when consumers value a product based on the loss they feel without it, rather than the gain. In the Western world, most consumers read prices from left to right, so there is a high likelihood of grasping the first number as an anchor. Under this theory, that’s why €599 would feel so different from €600, even though there is only a separation of €1.
-
A perception of gain: On the other side, perhaps consumers feel they have gained something, i.e., saved money, when they see an example of charm pricing. If the higher price of €600 is the anchor, then the lower price of €599 means you gained something and saved €1. This theory pairs well with the .99 or .95 pricing, which may make a consumer think they’re getting a discount.
-
Specificity: With a charm pricing strategy, the price of an item is so specific that it can trigger a psychological response in customers, who believe it must be priced at the correct value. This is especially relevant if pricing is fractional, meaning it ends in a cent value.

Example: Uniqlo
Although the apparel brand rarely has sales, they signify to customers that they are getting a good deal by ending almost every price in “-9.90” or “-4.90”.
Premium Pricing
Businesses using a premium pricing strategy want to keep their pricing levels higher than the competition. This can be paired with messaging and branding that shows customers why the higher price is justified.
For a premium pricing strategy to work, sellers usually have to have some combination of a strong brand image, unique offerings, or innovative product attributes. Examples of companies with a premium pricing strategy include Rolex, Apple, and luxury fashion brands like Louis Vuitton and Chanel.
Price Discrimination
Price discrimination, also called price differentiation or differential pricing, is a strategy employed by e-commerce companies to maximise profits by charging different prices to different customers for the same product or service, based on characteristics of the customer. The objective is to extract the maximum amount of consumer surplus and capture additional revenue based on individual customers' willingness to pay.
To use this strategy, sellers make use of their vast amounts of customer data, including browsing history, purchase patterns, demographic information, and geographic location. This data is leveraged to segment customers into different groups based on their preferences, behaviour, and purchasing power.

Once customer segments are identified, prices can be tailored to each segment's characteristics. For example, customers who have shown a higher willingness to pay in the past may be charged a higher price, while price-sensitive customers may be offered discounts or promotions to encourage purchases.
The success of price discrimination in e-commerce relies heavily on sophisticated data analysis and algorithmic pricing systems. By leveraging customer data and market conditions, companies can optimise their pricing strategies to increase revenue and overall profitability. However, it is important to note that price discrimination can also raise concerns about fairness, privacy, and potential consumer backlash if implemented in a way that is perceived as discriminatory or exploitative.
Overview of Psychological Pricing Strategies
| Strategy | Goal | Best Used For | Automation Level | Example or Note |
|---|---|---|---|---|
| Odd-Even Pricing | Influence the perception of value | Low- to mid-priced SKUs | Low | €19.99 feels cheaper than €20.00 |
| Charm Pricing | Create emotional appeal + encourage purchase | Fashion, cosmetics, D2C | Low to Medium | “3 for €20” bundles or .99 endings |
| Premium Pricing | Signal quality, exclusivity, or luxury | High-end brands, limited editions | Low | €199 instead of €179 to imply quality |
| Price Discrimination | Maximize margin from segmented buyers | Region-based or loyalty-pricing | Medium to High | Charging more for the same product in different countries |
Dynamic & Data-Driven Pricing Strategies
These strategies rely on automation, algorithms, and real-time data inputs.
Dynamic Pricing
Dynamic pricing is a strategy where prices are adjusted automatically and continuously in response to real-time data such as competitor prices, demand shifts, or inventory levels. For retailers, this helps maximize revenue opportunities, stay competitive, and align pricing with market conditions.
Sometimes, people also use "personalised pricing" interchangeably with dynamic pricing; however, these two are quite different from one another. Personalised pricing, as opposed to dynamic pricing, focuses on the individual consumer's behaviour and adjusts product pricing based on their past shopping experience.
When powered by automation, dynamic pricing software enables e-commerce brands to:
-
React instantly to competitor changes
-
Maximize profit margins without manual updates
-
Run A/B tests to identify price elasticity
-
Align price points with customer demand in real time
Price Optimisation
Price optimisation is a practice used in most e-commerce businesses that involves analysing data from customers and the market to calculate and set the optimal price for a product. The objective is to find the ideal price point to attract customers and maximise sales and profits. The types of data used can range from demographics and survey data to historical sales and inventory.
Pricing optimisation is similar to dynamic pricing, but while the former can be more of a long-term process, the latter is built more for rapid change and adjusts pricing based on real-time data.
Surge Pricing
Surge pricing is a pricing strategy that temporarily increases prices in response to high demand and limited supply. It is used in many industries, from hospitality and tourism to entertainment and retail. Here are three common types of surge pricing:
- Time-based: Adjusts prices based on the time of day or during special events and expected or real-time high-demand periods. For example, online retailers raise prices between 9 AM and 5 PM when customers shop online during office hours, as well as during large, industry-relevant events, like the Olympics, for sporting goods sellers.
- Weather-based: Incorporates weather forecasts to determine pricing decisions. When favourable weather conditions are expected, prices are increased. For instance, if the weather forecast promises good conditions for the summer, prices for beach goods, summer apparel, and BBQs can be raised in anticipation of higher demand.
- Location-based: Adjusts prices based on the geographical location of the buyer. It is often observed in crowded cities or areas with high-income populations, where customers have a higher willingness to pay. Additionally, surge pricing may be used in places with above-average shipping costs, resulting in higher prices.

Yield Pricing
Yield pricing is a pricing strategy most often seen in the aviation and hotel industries. It involves pricing differently depending on when the customer makes the purchase. Airline seats, for example, are priced based on where you are in the booking period: Booking earlier gets customers a lower price, while late bookings are at a higher price point. This enables those airlines to avoid empty seats and lost profits.
Overview of Dynamic & Data-Driven Pricing Strategies
| Strategy | Goal | Best Used For | Automation Level | Example or Note |
| Dynamic Pricing | React to market changes in real-time | Fast-moving consumer goods, electronics | High | Adjusting prices based on competitor changes or demand |
| Price Optimization | Maximize profit through data-driven testing | Enterprise retailers with high SKU count | High | A/B testing price points to find the revenue sweet spot |
| Surge Pricing | Capitalize on short-term spikes in demand | Travel, events, seasonal retail | Medium to High | Raising prices during holiday season or peak hours |
| Yield Pricing | Maximize revenue based on capacity/duration | Hotels, airlines, digital services | High | Pricing based on inventory status or time before use (e.g., flights) |
Real-time price changes create urgency and reinforce price fairness, especially in competitive verticals. When done transparently, they can increase conversions by showing shoppers they're getting the best deal available at that moment. However, inconsistent pricing without explanation can erode trust, which is why strategic communication and thresholds matter.
Competitive & Market-Based Pricing Strategies
These strategies respond to competitors or market position.
Competitive Pricing
One of the more common pricing strategies in e-commerce is competitive pricing, where sellers set their prices based on the prices of competitors.
Competitive pricing is most often used by businesses operating in competitive markets or ones with fairly similar products and little differentiation, as all sellers are then trying to win over the same customers. A competitive pricing strategy does not always indicate undercutting the competition, but rather setting prices in relation to competitors; this could mean setting product prices lower, higher, or the same as competing sellers.
Running a competitive pricing strategy with manual research can take a significant amount of time and is challenging in today’s fast-paced e-commerce environment. To make price adjustments for listings in real time, most companies use some type of Dynamic Pricing software.
Value-Based Pricing
Value-based pricing, sometimes called value-added pricing or perceived value pricing, is a powerful strategy that requires a deep understanding of the market and of the value your products offer to potential customers. Sellers can use value-based pricing to shape how consumers perceive their product. Want to position yourself as a luxury brand, or to be the best value-for-money option? Price accordingly.
Implementing value-based pricing demands extensive research into your target market and what the competition is doing, as well as reflection on and alignment with your business objectives. It will require collaborative effort across the organisation, but can create a very cohesive and effective pricing strategy.
Want to See How Pricing Strategies Come to Life in Practice?
Predatory Pricing
A predatory pricing strategy in e-commerce refers to a practice where a company deliberately sets extremely low prices for its products or services with the intention of driving competitors out of the market or deterring new entrants. By selling products at a loss or below cost for an extended period, the predatory pricer aims to eliminate competition and subsequently raise prices once competitors have been forced out.
Predatory pricing is often considered anticompetitive and is illegal in many jurisdictions as it violates antitrust laws created for consumer protection and to ensure market competition is fair.
Overview of Competitive & Market-Based Pricing Strategies
| Strategy | Goal | Best Used For | Automation Level | Example or Note |
| Competitive Pricing | Match or beat competitors to stay relevant | Commodity products, high-comparison items | High | Aligning prices to always be within 5% of your top 3 competitors |
| Value-Based Pricing | Align price with perceived customer value | Brands with strong differentiation | Medium to High | Pricing a premium eco-product based on customer loyalty and quality |
| Predatory Pricing | Undercut rivals to eliminate competition | New entrants disrupting a saturated market | Low to Medium | Temporarily pricing below cost to steal market share from incumbents |
Promotional & Launch Pricing Strategies
Short-term strategies are used for entry, promotions, or volume.
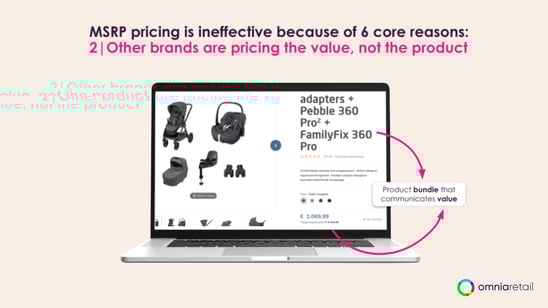
Bundle Pricing
Bundle pricing, also called product bundle pricing, is a strategy companies use to sell more items with higher margins while giving customers a discount for increasing the size of their order. Products are “bundled” so customers receive several different products as a package deal, costing them less than it would have if they made separate purchases of the included products. This incentivises purchases by creating higher perceived value and cost savings.
E-commerce companies typically select complementary or related products and combine them into bundles to encourage larger purchases, increase average order value, and enhance customer satisfaction. By offering discounted bundle prices, companies can attract price-sensitive customers, drive sales of slower-moving products, and create a competitive advantage in the market.
Promotional Pricing
A promotional pricing strategy in e-commerce involves offering temporary price reductions or discounts on products or services to create urgency, stimulate sales, and attract customers. The primary goals are usually to increase sales volume, clear out excess inventory, introduce new products, or gain a competitive advantage.
Promotional pricing can take various forms, such as percentage discounts, buy-one-get-one (BOGO) offers, limited-time sales, flash sales, coupon codes, or free shipping. These promotions can be advertised or offered through any channel, from email marketing and social media to online ads or on-site banners.
Penetration Pricing
A penetration pricing strategy is often employed by online sellers and business owners to attract customers to new products being brought to market. It involves offering an initial lower price than competitors to entice more buyers to purchase. The goal is to secure market share, undercut established sellers in the market, and attract new customers who will remain loyal, even after prices are adjusted back up.
For this e-commerce pricing strategy to succeed, however, there must be a high demand for the product. Without a significant market, penetration pricing becomes less effective. It's also important to make the price increases gradually to avoid competitors implementing their own penetration pricing tactics and stealing customers. Businesses employing a penetration pricing strategy will need price monitoring software to track and analyse average market prices over a set time period, then use the data to calculate introductory pricing.
Price Skimming
With a price skimming strategy, the product is initially priced high and then reduced later on, rather than starting with a low price like penetration pricing strategies. This approach aims to maximise short-term profits and segment customers based on how much they are willing to pay, and is often used for innovative products and products with high demand.
The top level of customers, the most loyal ones, will buy at high prices. The seller can then continue accommodating new levels of potential customers by gradually lowering (“skimming”) the price. This practice continues until it reaches the base price.
Price skimming can be a great way to quickly generate revenue and even break even with a lower number of sales, but companies must be able to rationalise the high price point, especially if the market is saturated and customers have other low-priced alternatives to choose from.

One real-world example of a price-skimming strategy is Samsung. When a new mobile phone release is planned and demand is high, the price is set higher to bring in more revenue and capture market share and attention from competitors like Apple. The newest model above, for example, retails for as much as €1.819,00 to start. After the demand and hype lessen, the company skims the price back down to reach more customers. Samsung Galaxy phones, for example, are priced to capture share from the iPhone.
Loss-leader Pricing
Loss-leader pricing, often used as part of a penetration pricing strategy, involves intentionally selling certain products at a loss to attract customers and stimulate additional sales of other higher-margin products. The purpose is to entice customers with attractive prices on popular or essential items, with the hope or expectation that they will make additional purchases of complementary or higher-priced items.
While the initial product may be sold at a loss, the strategy aims to generate profits through the sale of accompanying products or services. Effective implementation requires careful product selection, pricing analysis, and understanding of customer behaviour to ensure the overall profitability of the business.
Honeymoon Pricing
Like penetration pricing, honeymoon pricing sets the initial product price low during launch to attract customers. This strategy is common in subscription models, where a low-priced starter offer entices customers who must then be retained. Retaining customers in this model can be achievable, however, since switching providers may be expensive or require too high a level of customer effort.
Overview of Promotional & Launch Pricing Strategies
| Strategy | Goal | Best Used For | Automation Level | Example or Note |
| Promotional Pricing | Stimulate sales through limited-time offers | Sales events, seasonal campaigns | Medium to High | 20% off during Black Friday or end-of-season clearance |
| Penetration Pricing | Gain market share with low introductory prices | New product launches, entering competitive markets | Low to Medium | Launching at €9.99 to attract early adopters |
| Price Skimming | Maximize margin early before dropping price | Tech, innovation-led products | Low | €399 launch price gradually reduced to €299 over time |
| Loss-Leader Pricing | Attract traffic with low prices on key items | Brick-and-mortar and e-commerce storefronts | Medium | Pricing milk or earbuds below cost to drive footfall or conversion |
| Honeymoon Pricing | Build loyalty through early discounts | Subscriptions, memberships | Low to Medium | “First 3 months for €1” for a streaming or delivery service |
| Bundle Pricing | Increase AOV by packaging products together | D2C, consumer electronics, beauty | Medium | “Buy shampoo + conditioner together for €15” |
How to Find the Right Pricing Strategy for Your E-commerce Business
Choosing the right e-commerce pricing strategy requires careful analysis and consideration, and it’s worth noting that most sellers use some combination of strategies. Here are five key steps to guide your research and discussions as you build your pricing strategy:
- Understand your market and customers: Conduct research to gain insights into customer preferences and market dynamics.
- Analyse costs and profit margins: Evaluate expenses and calculate desired profit margins to assess feasibility.
- Consider your business goals and value proposition: Align pricing with your objectives and unique value proposition.
- Test, monitor, and adapt your strategy: Implement and continuously evaluate your pricing approach to optimise results.
- Stay agile and regularly evaluate pricing against competitors: Keep an eye on the market and adjust pricing as needed to remain competitive.
Over time, pricing strategies must adapt and evolve, both to keep up in the market and to meet the needs of the brand and product assortment. As you build, implement, and execute your pricing strategies, Omnia Retail can seamlessly automate any strategy you choose, blending any combination of rules with advanced Machine Learning and AI algorithms.
Put These Pricing Strategies to Work—Schedule a Demo With Our Consultants
Learn more about our revolutionary and intuitive approach to Dynamic Pricing here.
- What is Price Monitoring?: Check out everything you need to know about price comparison and price monitoring.
- What is Charm Pricing?: A short introduction to a fun pricing method.
- What is Penetration Pricing?: A guide on how to get noticed when first entering a new market.
- What is Bundle Pricing?: Learn more about the benefits of a bundle pricing strategy.
- What is Cost Plus Pricing?: In this article, we’ll cover cost-plus pricing and show you when it makes sense to use this strategy.
- What is Price Skimming?: Learn how price skimming can help you facilitate a higher return on early investments.


