
Price Points by Omnia Retail

09.07.2026
Prime Day 2026: A Pricing Data Analysis
Only 13.8% of European Products Actually Got a Real Discount Amazon moved Prime Day to June this year, ran it across 26 countries, and generated headlines about record-breaking sales. We tracked 1.19 million products...

27.05.2026
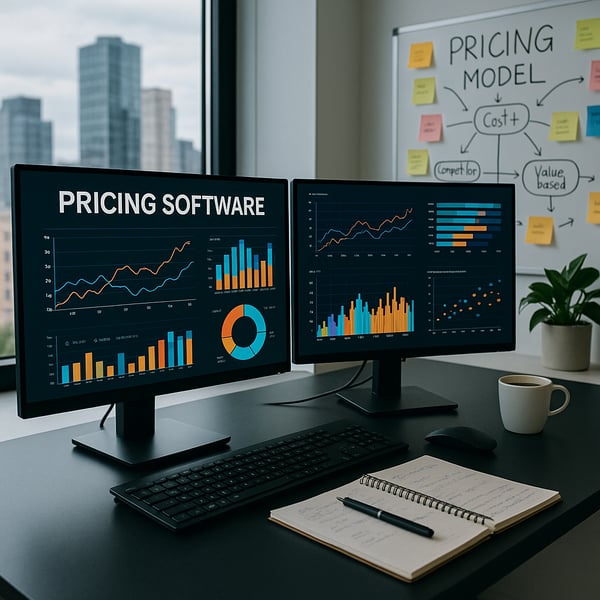
Best AI Pricing Software in 2026: Top Tools Compared
AI pricing software has moved well beyond automated repricing. The best platforms in 2026 combine real-time competitive data, demand-aware pricing logic, and agentic AI to help teams make faster, more confident...

13.05.2026
When Shopping Agents Meet Pricing Agents: Your Guide to Agentic Commerce
Your customer just asked ChatGPT to find them the best coffee maker under $200. Within seconds, the AI scanned 47 products across 12 retailers, compared 2,300 reviews, checked current inventory levels, and presented...

15.04.2026
Best Dynamic Pricing Software in 2026: Selecting the Right Tool for Your Needs
Dynamic pricing software helps retailers react faster to market changes, protect margins, and stay competitive across digital and omnichannel environments. For teams searching for the best dynamic pricing software, the...

09.04.2026
Why Agentic Pricing Is the Future of Retail Strategy
Customer acquisition costs jumped 233% between 2015 and 2025, climbing from $24-28 to $78-82. For European retailers already operating on thin margins, this isn’t just a statistic—it’s a survival challenge that demands...

08.04.2026
AI-Powered Pricing Automation Software: Revolutionizing Retail Strategies
Pricing automation software is rapidly becoming a core capability for modern retailers and ecommerce brands. As markets become more dynamic, competitors adjust prices daily, and customers compare prices instantly across...

01.04.2026
Prime Day 2026: Pricing Data Review, and What Retailers Need to Know
45.5% of products actually increased in price during Prime Day 2025. That’s not a typo—nearly half of all “discounted” items cost more during Amazon’s biggest sales event than they did before it started. This finding...

01.04.2026
How AI Retail Optimization Relates to AI Price Optimization and AI Dynamic Pricing
AI retail optimization is becoming a much broader and more strategic topic than many retailers initially expect. It does not refer to one isolated capability, and it is not limited to pricing alone. Instead, AI retail...

26.03.2026
Is Agentic Pricing Just a Chatbot? (And Other Common Confusions)
Three questions we hear constantly: “Is this just ChatGPT for pricing?” “Does ‘agentic’ mean it prices autonomously without human input?” “How is this different from the AI pricing tool we already use?” Let’s clear up...
.png?width=600&name=Omnia%20Agent%20Visuals%2020252026%20(1).png)
25.03.2026
AI Price Optimization: A Complete Guide to Smarter, Data-Driven Pricing at Scale
AI price optimization is quickly becoming one of the most important capabilities in modern retail and direct-to-consumer pricing. Competitors change prices daily, marketplaces increase transparency, and pricing teams...

18.03.2026
AI Pricing Analytics Software: From Dashboards to AI-Driven Pricing Intelligence
Pricing has become one of the most data-intensive functions in retail and direct-to-consumer commerce. Competitors change prices daily, marketplaces increase price transparency, and internal stakeholders expect faster,...

10.03.2026
How Agentic Pricing Software Changes the Day-To-Day for Retail Pricing Teams
It’s Monday morning, and you’re staring at three different dashboards trying to figure out why your match rate dropped 5% last week. Your competitor analysis spreadsheet has 47 tabs. The pricing team meeting starts in...

10.03.2026
How to Choose the Best AI Price Comparison Tools
Traditional price monitoring tools were built around dashboards. Pricing managers would log in, filter competitor data, export reports, and manually interpret what was happening in the market. While these dashboards...

24.02.2026
AI Dynamic Pricing: The Future of AI-Driven Retail and DTC Pricing
Retail pricing has changed. Markets move in hours, not weeks. Competitors update faster, marketplaces amplify transparency, and pricing teams are expected to protect margin while staying competitive across thousands (or...
.png?width=600&name=ORA%20Visuals%2020252026%20(11).png)
10.02.2026
Agentic Pricing Explained: The Next Generation of AI Pricing Software
From Automation to Intelligence: The Real Meaning of Agentic Pricing In our previous article on Agentic Pricing for Retail, we introduced Agentic Pricing as the next evolution of AI pricing software. We explained how...

29.01.2026
Retail Trends for 2026: A Look Into the Retail Crystal Ball
The retail industry in 2026 looks fundamentally different from even just two years ago. Pricing used to be a quarterly exercise: spreadsheet analysis, competitive positioning, maybe some seasonal adjustments. Now it's a...

22.01.2026
The Future of Pricing Is Agentic. And Today, It Begins
Bringing Some Breakthrough News It has been tough to keep quiet over the past months as the Omnia team has been excited about the technology breakthrough we have achieved. Today, we are ready to formally launch and...

23.12.2025
Best Pricing Software for Retail
Pricing software helps retailers in 2026 react to market changes in real time, protect margins, and stay competitive across online and offline channels. For teams searching for the best dynamic pricing tools for retail,...

05.11.2025
Drive Black Friday Sales: Competitive Pricing for DTC Brands
As we pointed out in our last research post on Black Friday pricing data analysis, the Direct-to-Consumer (DTC) market has fundamentally transformed. What was once considered a niche strategy has become the primary...

18.09.2025
Maximising Black Friday Impact: Strategic Pricing for E-commerce Retail
Black Friday is one of the most important events in the e-commerce calendar. It is a period when consumer spending surges and competition intensifies. For e-commerce retailers and D2C brands of all sizes, from...
.png?width=600&name=Untitled%20design%20(21).png)
17.09.2025
The DTC Strategy Guide: Building Profitable Channels Without Price Erosion
Direct-to-consumer (DTC) brands have revolutionized retail by offering unparalleled control over customer experience, pricing, and brand narrative. However, for established brands with existing wholesale and retail...
11.09.2025
Best Pricing Software for DTC Brands
Pricing software helps Direct-to-Consumer (DTC) brands update prices proactively, protect margins, and stay competitive without blanket discounts. The best platforms combine reliable data inputs, transparent price...
24.07.2025
Prime Day 2025: Pricing Data Review & Competitor Analysis
Amazon's Prime Day 2025 concluded last week, marking its longest duration yet, spanning four days from July 8 to July 11. The extended event was positioned by Amazon as another record-breaking success, with early...

04.06.2025
How Tariffs Shape Consumer Behavior and Brand Loyalty
Economic headwinds are nothing new in retail, and like past crises, they’re pushing retailers and brands to recalibrate pricing strategies. Today’s market shifts, driven by imposed tariffs, go beyond cost absorption,...

15.05.2025
How to Buy Pricing Software: A Guide for Retailers and Brands
In theory, buying pricing software should be straightforward: you define your requirements, compare a few platforms, and choose the one that suits your needs. In practice, however, the process tends to unfold quite...

24.04.2025
How to Set Up a Request for Proposal (RFP) for Dynamic Pricing Software
How you price your products defines how you compete. Dynamic pricing software gives you the tools to move with the market and react to shifts in supply, demand, and competition. But before you get there, you need the...

14.04.2025
Marketplace Pricing Secrets: Should You Use Different Prices on Amazon vs eBay?
Pricing on online marketplaces plays a vital role in e-commerce success. Online marketplaces now make up 62% of all online purchases. Retailers who sell on multiple platforms earn 190% more revenue than those selling on...

10.03.2025
Competitive Pricing as a Strategy: What Most Businesses Get Wrong in 2025
Your product's price can determine your business's success or failure. A small price difference could win or lose a sale in today's crowded markets, even though competitive pricing might seem simple. Competitive pricing...

23.12.2024
What is Price Discrimination?
What is Price Discrimination? In today’s highly competitive retail landscape, pricing is no longer just a numbers game—it’s a strategic lever that can make or break a business. As consumer expectations evolve and...

21.10.2024
Developing a pricing strategy: From 'Pricing by feel' to data-driven decisions
Pricing is one of the most important, and often misunderstood, topics in retail and e-commerce. The pricing 'iceberg' goes deeper than most expect. It starts with a single question: what company aims are you trying to...

15.10.2024
Understanding the impact of early preparation for Black Friday
Preparing early for Black Friday is essential for retailers looking to maximise sales and stay competitive in a dynamic market. By planning ahead, retailers can strategically adjust pricing, manage inventory and...

01.10.2024
Top 7 strategies for successful digital pricing transformation
7 Strategies for Successful Digital Pricing Transformation Pricing transformation means completely changing the way a company sets its prices, using new digital tools and technologies to make better pricing decisions....

17.09.2024
Top 17 Pricing Strategies for Retailers and Brands
Setting the right price for your e-commerce products is like playing a game with extremely high stakes, no clear rules, and ultra-intense competition. Choose the right price over time, and you can win over your target...

13.08.2024
The Ultimate Guide to Dynamic Pricing
What Is Dynamic Pricing and How Does It Work in Retail? Dynamic pricing is when a company or store continuously adjusts its prices throughout the day. The goal of these price changes is twofold: on one hand, companies...

19.04.2024
Reflecting on Price Points Live: Lessons for e-commerce in 2024
It’s been a few weeks since Europe’s e-commerce and pricing event of the year, produced and hosted by Omnia Retail, took Amsterdam by storm at the modern Capital C building in early March. Our invited guests were on the...

05.03.2024
Transparency in e-commerce: Leading the conversation at Price Points Live 2024
Europe’s e-commerce and pricing event of the year is returning in 2024, as Omnia Retail gears up for another exciting edition of Price Points Live. As leaders in e-commerce pricing across Europe, Omnia Retail is...

15.02.2024
Unleashing Superpowers in Pricing: How Omnia's Visual Decision Tree Approach Revolutionises Dynamic Pricing
Omnia Retail’s origin and purpose In 2012, my co-founder and I had conversations with category managers from established online retailers in mature e-commerce categories, such as consumer electronics, and learned that...

14.02.2024
How to Use Markdowns to Manage Stock throughout the Product Life Cycle
Any e-commerce seller knows how tricky markdowns can be. You don’t want to markdown stock too early when it could be selling at a higher price, but you also don’t want to markdown too late and end up with old stock you...

14.02.2024
Omnichannel Dynamic Pricing: Competition, Comparison and Consumer Behaviour
Think back to the last expensive product you purchased. Maybe it was a wearable like the newest Apple Watch, a pair of running shoes, or a new TV. How did you go about making your purchase? Did you just buy the item in...

08.02.2024
Omnia’s work on company culture takes centre stage in Frankfurt, Germany
“Even if you don't manage company culture, a specific culture will emerge. Although it probably won't be the culture you envisioned,” says Omnia Retail’s COO Vanessa Verlaan who presented on the topic of building a...

18.01.2024
The Future of Retail: Navigating E-commerce Trends and Innovations in 2024
E-commerce had a volatile 2023. From declining sales in luxury to behemoth partnerships to the resurgence of influencer marketing, the last 12 months experienced several changes and surprises that even the analysts were...

26.12.2023
Sustainability: Footwear gains traction in creating a circular economy
Reincarnating the shoe - that’s what some global brands in footwear are attempting to do with sustainability’s latest solution to a mounting climate change problem. A circular economy refers to an ecosystem where...

21.12.2023
Product bundling: The psychology for consumers and benefits for sellers
Brands and retailers have long used the strategy of bundling, combining two or more products into a separate product bundle, to boost sales and profits. Whether it’s brands choosing to bundle products, such as socks and...

14.12.2023
Black Friday sales increase, but holiday spending looks shaky
Consumers showed their resilience once more for Black Friday 2023 amid global economic turmoil as sales increased across multiple channels, categories and markets. Shopify and Adobe all shared positive year-on-year...

24.11.2023
Amazon and Meta's 2023 partnership share a common end-goal
Jeff Bezos and Mark Zuckerberg are smiling a little more as the fourth quarter of 2023 plays out, thanks to a striking new deal between Amazon and Meta: Instagram and Facebook users can now shop products directly from...
21.11.2023
Optimise Your Listings to Win the Amazon Buy Box
Marketplaces are one of the best channels for brands and vendors to create a successful e-commerce business. However, considering how many vendors are listed on the many marketplaces, not everyone can be highly...

14.11.2023
TikTok Shop: What’s in store for marketplaces with the new e-commerce platform?
The end of the third quarter of 2023 saw TikTok launch its new Shop tab in the US market, adding to an already unpredictable and fast-moving marketplace arena. While it may be too early to place its seat in the market,...

09.11.2023
E-commerce Shipping: A Guide on Costs, Speed and Environmental Impact
There are pros and cons to every method of shipping, whether international or local, and there’s also no “right” answer. Every e-commerce business is different, and the right shipping strategy depends on factors like...

17.10.2023
How will stubborn inflation impact e-commerce’s 2023 festive season?
If there is anything 2023 has taught retail and e-commerce leaders, is how resilient the consumer can be. As inflation predictions for the year remained lower than real-world inflation, and as food and gas prices...

10.10.2023
The Shape of D2C in 2023: How Established Brands and DNVBs Are Finding Success in E-Commerce
Is there anything that pairs better than e-commerce and direct-to-consumer (D2C) sales? With e-commerce, companies remove the inconvenience of having to go to a physical store, and products are shipped right to the...

10.10.2023
Solving the puzzle of e-commerce organisational structures
As any business owner or leader knows, building out the organisational structure of a company or team is one of the trickiest puzzles to solve. Do it right and the organisation will run smoothly and produce ideal...

10.10.2023
These are the vertical marketplace champions in Europe's strongest economies
Vertical marketplaces occupy a unique role in e-commerce: While the well-known giants try to encompass all categories, vertical marketplaces cater to specific and often specialised customer needs and interests. Selling...

28.09.2023
The Pros and Cons of Free Shipping for E-Commerce Businesses
Think back to the last time you bought something online: did you pay for shipping? These days, it’s becoming increasingly likely that you didn’t, either because the chosen seller offered free shipping or because you...

26.09.2023
Shopping Experience - What does Shopping Experience mean?
What does shopping experience mean? The term shopping experience covers all aspects of how a customer experiences its interactions with a vendor, at every touchpoint from the first contact through the transaction and...

22.09.2023
What quiet luxury tells retailers about consumer sentiment
A new trend in high-end fashion has emerged that speaks of a new era in how the ultra-wealthy convey their identity: Quiet luxury.

12.09.2023
Saniweb, one of the first to go live with our new pricing software
Press release Omnia Retail - September 2023

12.09.2023
Retail Pricing 2023 and Beyond
Three levers to success in an inflation-hit industry

25.08.2023
E-Commerce Brands & Retailers Building Trust with Transparent Pricing
Is there such a thing as too much honesty? In business, and in pricing, opinions differ. The concept of transparent pricing refers to having pricing information readily available and accessible to customers, benefiting...

22.08.2023
How Established Brands and DNVBs Are Finding Success in E-Commerce
Is there anything that pairs better than e-commerce and direct-to-consumer (D2C) sales? With e-commerce, companies remove the inconvenience of having to go to a physical store, and products are shipped right to the...

17.08.2023
How Retailers Can Ensure Compliance with the EU Omnibus Directive in 2025
After its first introduction in 2021, followed by some delays in implementation, the EU’s Price Indication Directive (PID) has been in full force since May 28, 2022, introducing tighter rules around how retailers...

15.08.2023
Sustainability in 2023: What brands and retailers can learn
There is something to be said about a brand or retailer and their respective leaders wanting to improve their impact on the planet. As we’ve known and seen for the last five decades, it would be easy and mostly...

02.08.2023
Psychological Pricing: Strategies, Examples, And Consumer Psychology
Modern-day pricing is so much more than a numbers game. When thought about correctly, it’s a powerful way to build your brand and drive more profits. But how do you access the full power of pricing? The key is to...

22.06.2023
How do brands become and stay relevant?
Are there any brands you used to love as a kid that are no longer around? What about brands that have lasted from before your childhood until the present day? Looking at the differences between these long-established...

14.06.2023
Amazon European Expansion Accelerator: What does it mean for sellers?
Amazon Europe is experiencing a shake-up designed to increase the e-commerce giant’s profits and market share, opening its European sellers to nine new markets across the region. On April 18th, Amazon announced a new...

01.06.2023
The Buyer Journey: Where Do Consumers Start Their Product Search?
In 2023, there are approximately 2.64 billion digital buyers, accounting for one-third of the global population; a huge pool of shoppers for e-commerce brands and retailers to sell to. But competition is fierce, and...

25.05.2023
How vendor ratings influence consumer behaviour in e-commerce
Picture this: It’s the 1980s. The Iron Curtain hasn’t fallen yet. Hairstyles are big, and punk culture is bigger. There’s no internet yet available to the public. You want to buy something new – maybe a bigger...
05.05.2023
Comparison shopping engines: How to optimise your presence
We live in a world of endless choice, and while the number of options can be exciting for shoppers, it can also be overwhelming. Comparison shopping engines (CSEs) have emerged as a valuable tool for shoppers to make...

28.04.2023
Pricing: An approach to prosperous business development
Isn’t it a scary thought that 75% of S&P 500 incumbents will no longer be listed on the index by 2027? Due to slow or nonexistent evolvement, Standard & Poor’s data show that the evolution of corporate success has been...

20.04.2023
Product Life Cycle: Pricing strategies for brands in the PLC
Living beings are not the only ones impacted by the circle of life; products have their own version, from birth (introduction) to death (decline) in the market. The Product Life Cycle (PLC) does not just happen to...

14.04.2023
The Impact of Social Media on Consumer Behaviour in e-Commerce
In recent years, social media has grown from a simple communication tool to stay in touch with friends and family to a powerful channel influencing consumer behaviour in e-commerce. With the rise of shopping online...

12.04.2023
How to Find Success on Marketplaces: A Guide for Brands
In the competitive world of e-commerce, marketplaces like Amazon, Google Shopping, eBay, and Idealo have become key players, connecting buyers with sellers and offering a simple way to comparison shop. Amazon, for...

01.04.2023
How to respond to competitor price changes without starting a price war
With the increased transparency in the market, pricing becomes a very competitive game. All retailers are monitoring one another, and a single price change can trigger a chain of price changes.

30.03.2023
AI, ads, and pricing: How is e-commerce marketing itself?
One of the questions we see asked most often in the e-commerce and pricing space is this: As an e-commerce company, what percentage of sales should be invested in marketing? When it comes to the size of your marketing...

28.03.2023
2023 trends and how stores can capitalise on an e-commerce slump
We all experienced the sudden, dramatic shifts in retail during the first year of the COVID-19 pandemic. Stores shut down, sales shifted online, and the number of ecommerce companies globally (excluding China) grew to...

23.03.2023
E-commerce Discounts: Types, Benefits, and Best Practices In 2026
Considering that mobile sales hit $142.7 billion last holiday season, that's 56.1% of all online purchases happening on smartphones. Meanwhile, a third of shoppers are now using AI tools to comparison-shop in real-time,...

23.03.2023
Meet the Team: Vanessa Verlaan
Name: Vanessa Verlaan Company Role: Chief Operations Officer

23.03.2023
Meet the Team: Julian Bieber
Name: Julian Bieber Company Role: Working Student Backend Development

21.03.2023
Why Brands Should Curate Their Product Assortment
The direct-to-consumer (D2C) wave continues to sweep across the world of e-commerce, but unlike early examples of D2C brands who started out that way, we are seeing more companies add DTC sales to existing retail...

09.03.2023
Developing Average Order Value over time in e-commerce
When you start getting pressure from the top to increase revenue, maybe your first thought as a marketer is to go out and try to win new customers. But there are other ways to boost sales. Instead of investing heavily...

02.03.2023
Amazon moves to cut distributors to improve profits
In a bid to increase annual profits, Amazon is actively severing its relationships with third-party sellers. From 15 January 2024, as an email from Amazon to third-party sellers suggests, the e-commerce authoritarian...

23.02.2023
Meet the Team: Melissa Cron
Name: Melissa Cron Company Role: Junior Consultant

23.02.2023
Meet the Team: Anas Anjaria
Name: Anas Anjaria Company Role: Backend Engineer
22.02.2023
E-commerce prices drop by 1% in January 2023 compared to 2022
Online shopping prices saw a 1% decrease in January 2023, compared to prices during the same time in 2022. In a consistent trend with decreasing e-commerce prices, January became the fifth month in a row that...

16.02.2023
D2C in 2023: What we predict and recommend for brands
In 2019, as a retailer, a D2C brand, or a pricing expert; if you heard the statistic that, in 2022, 64% of consumers will make regular purchases directly from brands, you’d likely wonder what could possibly take place...

02.02.2023
Design Infringement in Fashion: A Growing Concern for Brands
The line between creative inspiration and infringement can be thin, dotted, or invisible at times. This was one of the lessons that Adidas had to learn this month when it lost its $8 million lawsuit against American...

31.01.2023
The Evolution of the Beauty Industry in 2025 and Beyond
In 2025, the beauty industry's trends will deviate from current predictions. While many reports forecast continued exponential growth, a more nuanced reality is emerging, with significant underlying shifts that are...

26.01.2023
Meet the Team: Jolene Ekuam
Name: Jolene Ekuam Company Role: Junior Consultant

26.01.2023
Meet the Team: Yuqiang Liu
Name: Yuqiang Liu Company Role: Backend Developer
23.01.2023
A Guide to Price Skimming: Definitions, Strategies and Tactics
Price skimming is a pricing strategy that can facilitate a higher return on early investments, influence the branding and appeal of a product, and allow a brand to target specific segments of a given market. This...

18.01.2023
Amazon layoffs: Tech and retail contend with a post-pandemic slump
During the peak of Covid-19, businesses around the world experienced the toll of the pandemic with either sky-rocketing growth or heartbreaking closures. The structure of national lockdowns and social restrictions meant...

11.01.2023
Analysis: Prices on Zalando drop by up to 23% over Black Friday
Despite slow performance expectations for Black Friday 2022, retailers and marketplaces around the globe proved once again how well a shopping event like Black Friday can do - even in the face of record-breaking...

22.12.2022
Meet the Team: Melissa Castelyn
Name: Melissa Castelyn Company Role: Financial Controller

22.12.2022
As we head into 2023, Omnia reflects on a successful year behind us
Like any good sports team, Omnia takes a look at its wins and losses that shaped the year. With the acquisition of Patagona in 2021, this year would be the first full year as a combined company, bringing challenges and...

22.12.2022
Meet the Team: Max Bäumer
Name: Max Bäumer Company Role: Team Lead Technical Support

19.12.2022
Festive season: Omnia sees chances for beverages market gains
Retail is experiencing a first this festive season: This is the first time in 92 years that the industry has had to contend with Black Friday, Christmas and a World Cup all at the same time. In addition, 2022’s...

08.12.2022
By 2023, 27% of a consumer’s cupboards will be made up of pre-owned items
When you think about all the times you received a gift that ended up in your storage cupboard for a few years, here’s a statistic that is sure to shock you: Each year, the UK spends approximately £700 million in...

01.12.2022
Christmas Gifts in 2022: A Conundrum of sustainability and capitalism
A large part of the festive season is buying gifts for friends and family, as well as ourselves, with the November to January period being retail’s most profitable and chaotic time of the year. With inflation and the...

24.11.2022
Meet the Team: Manuel Zahn
Name: Manuel Zahn Company Role: Team Lead of Team Constellation

24.11.2022
Meet the Team: Elisa Mozena
Name: Elisa Mozena Company Role: Senior Corporate Recruiter

24.11.2022
Price Points Live: Prof Hermann Simon on goal-setting and true profit
Considering the impact of inflation and lagging economic growth on the books of eCommerce shops and retailers in Europe and the UK, taking advice from the world’s leading speaker on pricing and profit may be a good...
23.11.2022
Black Friday 2022: Our predictions and recommendations

22.11.2022
Price Points Live: A more sustainable eCommerce industry is possible
“Online shopping produces up to 4x less carbon dioxide emissions versus traditional store shopping,” says Dr Heleen Buldeo Rai, a researcher at the Université Gustave Eiffel in Paris, who joined the panel of speakers at...

17.11.2022
Price Points Live: How retailers can benefit from consumer psychology
In the last few months, the EU has experienced inflation at a high of 10.1% as well as a slight economic recession, as predicted by ABN AMRO Bank’s Senior Economist Aline Schuiling. So, with unprecedented inflation...

15.11.2022
Price Points Live: Inflation is set to decrease to 2% in 2024
With inflation being the number one issue on the minds of business owners, economists and consumers alike, it was no surprise that the topic was first on the list during Omnia’s annual Price Points Live event, which...

27.10.2022
E-commerce and pricing take centre stage at Price Points Live
Europe’s greatest minds in e-commerce, pricing, retail, and consumer psychology converged on Saint Olof’s Chapel in Amsterdam on Thursday 13 October 2022 to share their knowledge in an exciting panel discussion event,...

27.10.2022
Meet the Team: Srinivas
Name: Srinivas Sista Company Role: Operations Process Manager

25.10.2022
How inflation is affecting production and overconsumption
With falling profits, rising inflation and bloated overhead costs, the world of retail and eCommerce is experiencing one of its biggest challenges since the 2008 global recession. Wall Street reported that of the 79...

20.10.2022
As retail awaits higher spending this festive season, brick+mortar enjoys a comeback

19.10.2022
After rising inflation, consumers turn to credit and more debt
Inflation is not a new phenomenon that consumers, businesses, banks or e-commerce giants have had to deal with. The first time the term was used to describe an inflation of a currency was in Latin in 1838; after which...

28.09.2022
Dynamic pricing strategies and tactics to cope with inflation
High inflation is here to stay for years to come Across the world, inflation remains at sky-high levels, with the G20 average Consumer Price Index (CPI) at 9.2% year-on-year for July ‘22 and the OECD countries at 10.2%...

21.09.2022
What can the European e-commerce industry learn from the US?
Although Europe is not in the top five e-commerce markets globally, it should not be discounted as a strong contender within the pool of the most successful e-commerce markets around the world: It's valued at $827...

15.09.2022
The e-Commerce Consumer Journey
If the planners and strategists of successful brick-and-mortar stores from 30 years ago knew just how vital the consumer journey would become to the success of retailers, they’d give themselves an extra pat on the back....

15.09.2022
Complete Guide to Selling on Amazon in 2022
With a massive reach (to the tune of 47% market share in the US and UK and 31% market share in Germany), it’s an incredible outlet to showcase products, earn more sales, and build brand awareness.

01.09.2022
How important is UI/UX in the online shopping journey?
Anyone working in the digital space in the early 2000’s can remember the experience of visiting a website: Blurry images, large bodies of text, broken links, slow page speed, empty categories and many more, as the world...

25.08.2022
How we collect vital data for our customers (Part 2)
In recent years, data has surpassed oil in being the most valuable commodity on Earth. In just the four years between 2016 - 2020, the data market in the US grew in value from €129 billion to €211 billion. In a...

24.08.2022
Meet the Team: Brend
Name: Brend Kolfschoten Company Role: Junior Consultant

18.08.2022
Faster shipping is changing demands, with retailers edging to keep up
There is a reason a retailer’s shipping or delivery method is called “the last mile”. It’s easily one of the most challenging and complicated parts of the logistical and supply chain process - and one of the most...

16.08.2022
E-commerce giants are using consolidation to gain market share
Mergers, acquisitions and consolidation: Three words the average consumer would expect to only hear in the sky-high buildings of the Central Business District (CBD). However, these strategic processes are more a part of...

04.08.2022
The Future of Marketplaces
Of the $5 trillion global digital commerce market, $3 trillion comes from marketplaces alone. As a niche of the e-commerce industry, that’s quite an achievement, considering how many more individual online stores there...

03.08.2022
What e-commerce players need to begin their pricing software journey (Part 1)
When the concept of retail first began in ancient Greece in 800 BC with traders selling goods and food at markets, merchants needed to keep track of their stock in a similar way retailers do so today. It began with...

02.08.2022
Are we seeing the rise of social commerce?
“Where did you buy those jeans from?” someone may ask. “On Instagram,” another may say. Ten years ago, that answer would’ve received a confused, eyebrow-raising expression. Today, it is met with someone picking up their...
15.07.2022
A Guide to Amazon Marketing
One of the best ways to use the full power of Amazon is to tap into its advertising capabilities. With such a huge reach into consumer markets, it’s a unique channel for advertising specific products, building your...

14.07.2022
Antoine Brouwer: E-commerce, its challenges and dynamic pricing | Part 2
A few days ago, we shared the first part of our insightful conversation with one of Europe’s top e-commerce and digital marketing minds, Antoine Brouwer. We’re excited to share the second and final part with you today.

13.07.2022
Meet the Team: Dennis
Name: Dennis Koschinski Company Role: Backend Developer

13.07.2022
How does Amazing Pricing work? A Guide for Retailers & Brands
It’s no secret that pricing on Amazon is complex, and Sellers get lost quickly in the world of Amazon pricing.

13.07.2022
Revolutionising graduate traineeships within the SaaS landscape
As creators of the first Dutch scaleup traineeship within SaaS, Omnia Retail is changing how newcomers to the industry can learn and importantly grow.
07.07.2022
Antoine Brouwer: E-commerce, its challenges and dynamic pricing | Part 1
We sat down and spent some time with one of Europe's greatest minds in e-commerce and digital marketing. Antoine Brouwer, he shared his thoughts with Omnia Retail on e-commerce in 2022, his forecast, thoughts on trends...

06.07.2022
The growing volume of voice search for retail purchases
Voice commerce is impacting retail and e-commerce When the phrase “Hey, Siri” was first announced with Apple’s launch of its virtual assistant in 2011, not even the most forward-thinking of retail experts could have...

22.06.2022
Gen Z is changing and influencing buying behaviour across retail
You may have heard the terms “Generation Z” and “Millennials” as a way to describe a certain age group, however, the terms are also being used to describe a certain trend, be it in the change in spending habits or...

14.06.2022
How robotics and AI are improving supply chains
If only Henry Ford, the founder of Ford Motors who invented the assembly line that revolutionised how cars are made, could see how corporations have advanced the logistics of supply chains in 2022. Approximately 109...

14.06.2022
Meet the Team: Yaza
Name: Yazah Wainakh Company Role: Software Developer

26.05.2022
Grey Markets: A 20-Billion Euro Industry
Over the last two decades, as the growth of e-commerce has propelled the retail industry forward, a parallel trend has taken shape: The rise of the grey market or parallel market. The expansion of online stores like...
24.05.2022
Pricing as the new commander for financial growth
Figuring out a price for your product or service is not dissimilar to walking on a tightrope. On the one hand, you could purposefully overprice your product to increase profits and place your product as high-end,...

24.05.2022
Meet the Team: Tim
Name: Tim Avemarie-Scharmann Company Role: Head of Knowledge & Scalability

04.05.2022
Omnia appoints a new CFO, supporting its vision and leadership
As Omnia Retail moves into the next phase of growth, a new member of its leadership team is set to assist in driving forward the company’s multinational strategy: Hande Erdogan, Omnia Retail’s new Chief Financial...

25.04.2022
Meet the Team: Milena
Name: Milena Shayan Company Role: Customer Success Manager

25.04.2022
Meet the Team: Hector
Name: Hector Rubin Company Role: Junior Consultant Trainee

14.04.2022
The new era of the retail consumer
Not even the Wall Street crash of 2008 saw the retail world having to relearn the wants and needs of the modern consumer as much as the last two years of the coronavirus pandemic. As 2022 enters its second quarter,...

12.04.2022
Omnia Retail celebrates 10 years as Europe’s leader in pricing software
Celebrating an important milestone for a company that largely founded and revolutionised pricing software solutions across Europe a decade ago, Omnia Retail celebrated its 10th birthday last week with a team event at...

22.03.2022
Meet the Team: Marielle
Name: Marielle Roozendaal Company Role: Employee Experience Manager

17.03.2022
Meet the Team: Andreas
Name: Andreas Frankenberger Company Role: Chief Technical Officer (CTO)

15.03.2022
Optimise product and pricing now, as inflation in the EU hits 5.8%
Across the market, consumers are paying noticeably higher prices for purchases online as a result of inflation. January marked 20 consecutive months of year-over-year online inflation. So, while consumers watch prices...
10.03.2022
For the bicycle industry, 2022 presents a continued supply chain crisis
“Those who’ve recently ordered pre-assembled bikes from industry giants like Specialized, Canyon, Trek and many others may still be waiting another year to receive their bike.”

02.03.2022
Is this the end for e-commerce merchants as brands take the lead?
“Are retailers and brands like Decathlon, Nike and others changing the current narrative to better suit the needs of customers and their profit margins, blurring the lines between brand and retailer?”

22.02.2022
Meet the Team: Nik
Name: Nik Shulrufer Company Role: Software Developer

21.02.2022
Meet the Team: Ola
Name: Ola Aboamer Company Role: Lead Frontend Developer

15.02.2022
Omnia signs the SER Diversity in Business charter, adding a milestone to its D&I strategy
Omnia Retail has proudly signed the SER Diversity in Business charter for equal workplace treatment, further showing our commitment to building an open and inclusive environment for all of our employees and becoming a...

08.02.2022
Omnia's 2022 Diversity Efforts: Are EU Businesses Keeping Up?
The global coronavirus pandemic has peeled back the curtain on a number of trends and problems within the global workforce, a major one being the importance of diversity and inclusion within companies. More so, in 2021,...

18.01.2022
Meet the Team: Leon
Name: Leon Curling-Hope Company Role: Head of Marketing

18.01.2022
Meet the Team: Maximilian
Name: Maximilian Bank Company Role: Chief Commercial Officer
18.01.2022
Launch of a new SaaS product for brands
Pricetracer, an easy-to-use flexible pricing tool, providing control, analytics and knowledge to brands within the world of e-commerce from the new European market leader in pricing software.

12.01.2022
Omnia achieves top position as the G2 Market Leader for 2022
Omnia Retail has been recognized twice within the G2 Grid® for 2022. Both as the momentum leader and holding the top spot within the Pricing Software segment, reaffirming Omnia Retail as the European leader.
07.12.2021
What is Surge Pricing?
It is New Year’s Eve, and you decided to go to a party. Together with your friends, you order an Uber via the Uber app and once you’ve opened it you get a notification: “Demand is off the charts! Fares have temporarily...

17.11.2021
Omnia acquires Patagona to become leading pricing software provider
This Thursday Omnia Retail announced the acquisition of German pricing software provider Patagona. Both companies are specialized in dynamic pricing software and with the integration Omnia will become Europe’s leading...

06.10.2021
Managing Inflation through your Pricing Strategy
Consumer prices increased by 5.4% last June compared to the year before. Inflation is rising with high speed and challenging times for retailers and brands are present. The uncertain economic environment and rising...

27.08.2021
Google Analytics and Omnia
Over the years, Google Analytics has become an undeniable ally to many retailers and brands engaging in ecommerce. The tool can provide a gold mine of data and insights on your website’s performance. For instance, page...

26.08.2021
Meet the Team: Santiago
Name: Santiago Alfaro Gimeno Company Role: Junior Consultant

12.08.2021
How pricing influences the consumer decision making process
Pricing has a major influence on a consumer’s decision making process and if you know how to take advantage of this, you can increase both sales volume and revenue. This is because there are a few key factors that a...

15.07.2021
Adjusting your Pricing Strategy to the Product Life Cycle Stage
Product life cycle is a well known retail concept that is vital for brands and distributors alike when they go to the market with a new product. For professionals throughout the industry guiding a product through its...

01.07.2021
Meet the Team: Kristina
Name: Kristina Kukhalashvili Company Role: Junior Consultant

01.06.2021
Meet the Team: Suzanne
Name: Suzanne Meinders Company Role: Junior Consultant

05.05.2021
Should Dynamic Pricing Change Your Company's Pricing Organization?
How to set up your organization's pricing team? Within our customer base we often see that a dynamic pricing initiative supported by software implementation is a moment to rethink pricing responsibility. Historically...

21.04.2021
Meet the Team: Tommy
Name: Tommy Hackley Company Role: Junior Consultant

12.04.2021
What is loss leader pricing?
The phrase ‘Loss Leader Pricing Strategy’ can sound confusing, tautologous or even verge on doublethink. It is a strategy defined by its aggression, inherently risky nature and being shrouded in questions of ethicality...

01.04.2021
Winners vs. Losers: Optimal Price Ratio Depends on Category Elasticity
In this thread we are investigating and ultimately uncovering what everybody wants to know: when it comes to pricing, what separates the winners from the losers. Last time we covered price change frequency and why it is...

15.03.2021
Meet the Team: Marwa
Name: Marwa Lamouni Company Role:

02.03.2021
Winners vs. losers: how important is the price change frequency?
Value based pricing, price change frequency, marketing cost incorporation, elasticity calculation.... There is an abundance of factors to take into consideration and an unlimited number of strategies related to pricing....

23.02.2021
Understanding and Using Market Penetration Strategies
Did you start a brand to see it lose momentum or market share to competitors? It’s a silly question to ask owners yet a number of brands make mistakes within their chosen market. At times, it’s not a matter of what...

04.02.2021
Meet the Team: Saskia
Name: Saskia Zoe Mueller-Herbst Company Role: Junior Consultant

04.02.2021
How to reprice online assortment without frustrating store employees?
The ability to reprice your product at a high frequency is one of the most impactful tools to control revenues and margins. The whole market is transparent and price differentiations are very visible to consumers. Price...
04.02.2021
Margin vs revenue: how to stay competitive and profitable?
Everyday low pricing is no longer a sustainable business model. In most categories, margins are too small. Setting the lowest price for every product spells bankruptcy. Even in categories with healthy margins, margins...

28.01.2021
Business Guide to Predatory Pricing
In 2010, Diapers.com gained momentum with its combination of e-commerce and pricing. Rumours report that Amazon previously tried to buy the diaper supplier but was denied. Afterward, Amazon aggressively lowered prices...
06.01.2021
What is MAP Pricing? A Comprehensive Guide
A fundamental part of e-commerce (or really commerce itself) is the idea of competition. Competition is healthy and serves as the key mechanism that protects consumers — when companies have to compete to sell products,...

05.01.2021
Meet the Team: Martijn Crooijmans
In this edition of Meet the Team we have Martijn Crooijmans in the starring role. Martijn is one of our fresh Junior Consultants within our new traineeship program.

30.12.2020
Amazon is closing in on Dutch competitors
In short: Web giant Amazon is putting Dutch web stores under pressure with rock bottom prices. Thousands of popular products are 7% to almost 18% cheaper at Amazon than at competitors such as Bol.com and Coolblue. At...

19.11.2020
Holiday Playbook 2020
E-retail sales eclipsed $3.5 trillion in 2019 and Cyber Monday sales hit 9.4 billion. The ecommerce trend continues to dazzle retailers who are excited to offer goods yet struggle competing with behemoths like Amazon.

18.11.2020
Holiday Playbook 2019
When it comes to Black Friday, your price matters a lot. In fact, according to Google, pricing and promotions are 13% more influential in the week leading up to the third Friday in November.

15.10.2020
Omnia's Customer Success Philosophy
Set up for success. Yes, product is important. But what matters more is how the product helps you reach your goals. That’s why at Omnia, in addition to giving you the best dynamic pricing solution on the market, we...

15.10.2020
High-quality Data is Expensive, and That's a Good Thing
That’s right. High-quality dynamic pricing data costs money, but it’s money you should be happy to spend. Why? Here are four things you should know about data quality with pricing (and why it’s important you get the...

15.10.2020
Retail Pricing Wars Report
Automation in the UK Retail Industry?

15.10.2020
Why Pricing and Marketing Go Hand in Hand
Get your data to work for you.

15.10.2020
7 Ways Pricing Insights Make Your Job Easier
Download the whitepaper to learn:

15.10.2020
Webinar: Adapting To A New Normal After Covid-19, A Retail Perspective
In this webinar you'll learn:
15.10.2020
Pricing and Data Quality
Quality data is the foundation for any dynamic pricing solution.

15.10.2020
What to Look for in a Dynamic Pricing Solution
If you’re a retailer or a brand, pricing is one of the linchpins of your overall commercial success. And if you’re considering a dynamic pricing solution, we understand that finding the right one for your organization...

14.10.2020
The shift to Direct to Consumer


14.10.2020
Price Points Podcast EP 9: Which Categories Experience the Most Price Pressure on Black Friday?
Which categories experience the most price pressure on Black Friday? Hidde Roeloffs Valk explains his data analysis in this month's episode of Price Points.

14.10.2020
Price Points Podcast EP 8: Why is Data Important to Dynamic Pricing
Dynamic pricing is a tool, yes, and while it's an insanely smart tool, it can only work with the information it's given. What you put into a dynamic pricing solution as input matters and makes a huge impact on the price...
14.10.2020
Price Points Podcast EP 7: Are Your Private Label Products Overpriced
Are your private label products over (or under) priced? Hidde Roeloffs Valk, Solution Consultant at Omnia, explains how a reference pricing strategy helps you optimize your private label products and keep them at...

14.10.2020
Price Points Podcast EP 6: The Power of Customer Success
What is "Customer Success," and why is it so important to dynamic pricing? Omnia Vice President of Customer Success Haiko Krumm tells all in this episode of Price Points.

14.10.2020
Price Points Podcast EP 5: Building vs. Buying a Dynamic Pricing Solution
Thinking of building your own dynamic pricing solution in-house? Product Manager Berend van Niekerk tells you everything you need to know for your solution to be a success.

14.10.2020
Price Points Podcast EP 4: Maintaining Organizational Clarity
What's the top trick to getting the most out of dynamic pricing? Communication. In this episode Gijs Schuringa explains why organizational clarity and communication is crucial to dynamic pricing success, and gives you...

13.10.2020
Price Points Podcast EP 3: Risks and Rewards in Dynamic Pricing
What are the risks and rewards of dynamic pricing, and how can you tip the scales towards reward? Travis Rice explains all in this episode of Price Points.
13.10.2020
Price Points Podcast EP 2: Why Should Brands Differentiate Their Assortments
How important is a brand's assortment to its D2C strategy? In this interview with Hidde Roeloffs Valk from Omnia Retail, we dive into assortments and uncover how they are an essential tool in a modern e-commerce...
13.10.2020
Price Points Podcast EP 1: What Do Brands Need for a successful D2C Strategy?
What do brands need for a successful D2C strategy? Learn more in this interview with Jasper Wiercx, Solutions Consultant at Omnia Retail

25.08.2020
What is Bundle Pricing?
When it comes to online shopping, bundle pricing is ubiquitous. This pricing method is extremely popular amongst Internet retailers, and for good reason. Competitive bundling is an excellent way for you to push more...

13.08.2020
Cost Plus Pricing: A Complete Guide to Cost-Based Pricing, Markups, Margins & Retail Strategy
When you produce a product, it costs your company a certain amount of money.

07.08.2020
Here’s What You Need to Know About Psychological Pricing (Plus 3 Strategies to Help You Succeed)
Modern day pricing is so much more than a numbers game. When thought about correctly, it’s a powerful way to build your brand and drive more profits.

30.07.2020
Meet the Team: Niels Botman
Whether car camping in Namibia, speeding around Medemblik, or in his work at Omnia, Niels Botman, our Product Business Analyst, has a keen sense of adventure. In this month’s “Meet the Team,” you’ll get the chance to...